National Center for Risk and Disaster Management – CENAD / Centro Nacional de Gestão de Riscos e Desastres – CENAD
Centro Nacional de Monitoramento e Alertas de Desastres Naturais – Cemaden/MCTI
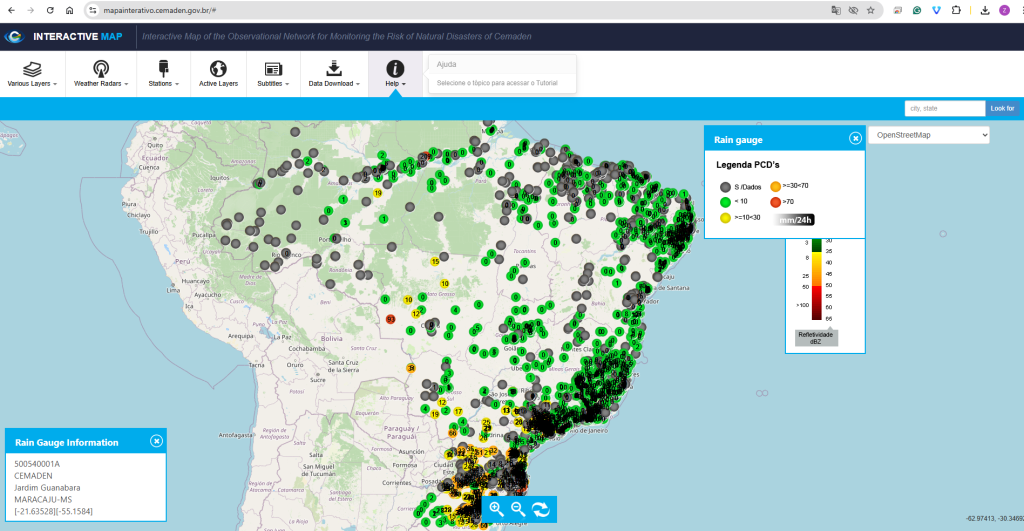
Mapa Interativo da Rede Observacional para Monitoramento de Risco de Desastres Naturais do Cemaden
O MHEWC gostaria de agradecer ao governo brasileiro pela manutenção do geoportal do Centro Nacional de Gestão de Riscos e Desastres – CENAD.
https://mapainterativo.cemaden.gov.br
https://www.gov.br/cemaden/pt-br/assuntos/monitoramento
Monitoring
Report on Droughts and Impacts in Acre
RiSAF – Drought Risk in Family Farming
Bulletin on the Impacts of Hydro-Geo-Climatic Extremes on Strategic Activities for Brazil – 09/10/2025 YEAR 08 No. 83
Share:
Share via Facebook Share via Twitter Share via LinkedIn Share via WhatsAppCopy to clipboard link
Published on 10/15/2025 at 9:21 AM
Photo: Alan Pimentel
This edition of the Monthly Bulletin on the Impacts of Hydro-Geo-Climatic Extremes on Strategic Activities for Brazil, prepared by the National Center for Monitoring and Alerts of Natural Disasters (Cemaden), a Research Unit of the Ministry of Science, Technology and Innovation (MCTI), presents: (a) an assessment of occurrences and alerts for hydro-geo-climatic disasters (floods, flash floods and mass movements) for the month of September, and (b) a diagnosis and scenarios of rainfall extremes (droughts and floods) and their impacts on different economic sectors in Brazil for the October, November and December (OND) 2025 quarter.
Sending Alerts and Reporting Incidents
In September 2025, the Cemaden Situation Room issued 53 alerts, 38 of which were hydrological in origin and 15 of which were geological in origin.
Hydrological Risk: Current and Projected Situation
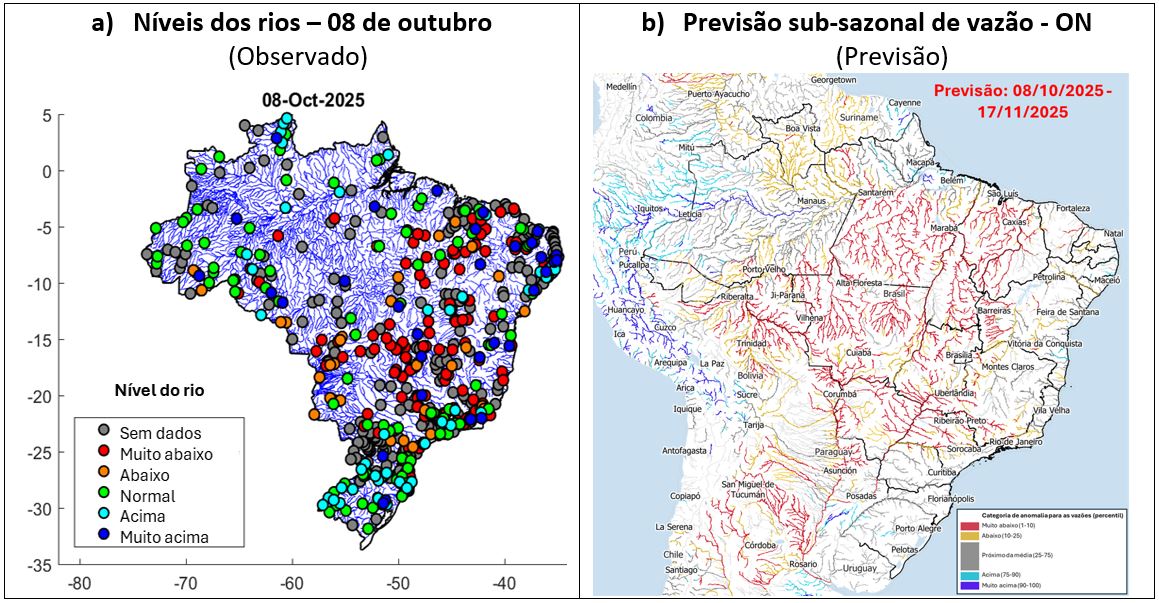
The situation of the levels of the main rivers in Brazil in relation to the climatological average of the hydrological stations of the National Water and Basic Sanitation Agency (ANA), referring to October 8th, is illustrated in Figure 1a . It can be observed that, in the northern portion of the North region, the rivers have levels above or close to the climatological average. Furthermore, in the northwestern portion of the Central-West region, in the eastern portion of the Northeast region, in the southeastern portion of the Southeast region, and in a large part of the South region, the river levels are also above or close to the average. On the other hand, many rivers located in the western and southeastern portions of the North region, in the western portion of the Northeast region, a large part of the Southeast region, mainly in the western portion, as well as in the eastern and southern portions of the Central-West region, have levels below the climatological average.Figure 1. Situation of river levels in Brazil on October 8th in relation to the climatology of hydrological measurement stations (a) and sub-seasonal flow forecast from October to November 2025 – ON (b).
The seasonal forecast for the next 45 days – ON of the Global Flood Warning System (GloFAS) model in Figure 1b , indicates a continued probability of flows above or well above the climatological average for the period in the northwestern portion of the North region, between the Juruá, Solimões and Negro rivers and between the states of Amapá and Pará, a probability of flows close to the average for the period in the eastern portion of the Northeast and Southeast regions and a large part of the South region of Brazil, and a probability above 75% for flows below the climatological average in the remaining areas of the country.
Impacts of Drought on Vegetation and Agriculture
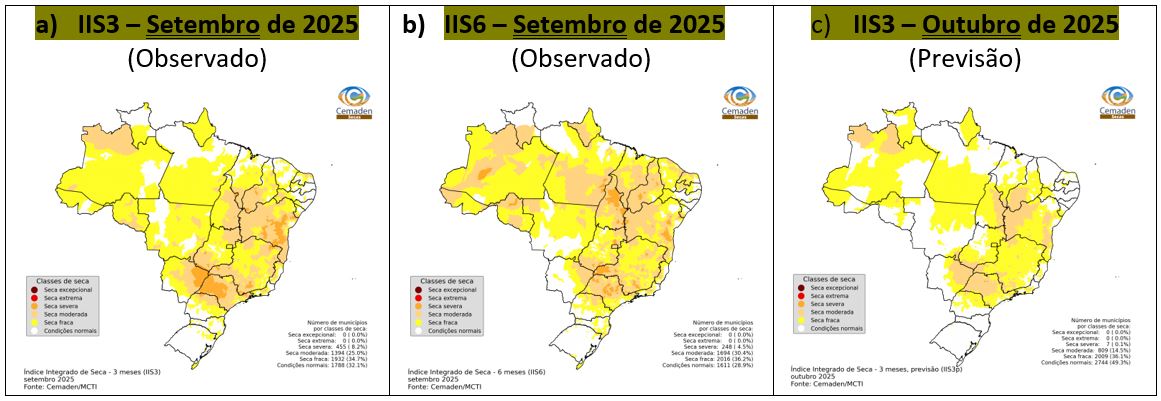
The number of municipalities experiencing severe drought increased from 109 in August to 460 in September; however, there were no records of municipalities experiencing extreme or exceptional drought, as indicated by the Integrated Drought Index (IIS3, Figure 2a ). Meanwhile, moderate drought decreased from 1327 to 1394 municipalities, and mild drought decreased from 2010 to 1932. Over a six-month period, a decrease in drought severity was also observed ( Figure 2b ). The number of municipalities experiencing severe drought fell from 460 in August to 248 in September, with no records of extreme or exceptional drought. Moderate drought increased from 1386 to 1694 municipalities, and mild drought decreased from 2263 to 2016 municipalities. The central region of the country continues to concentrate the most critical areas, with the drought persisting in the corridor that encompasses parts of the Southeast (Minas Gerais and São Paulo), Midwest (Goiás and Mato Grosso), Northeast (Bahia and Piauí), and North (Tocantins and Pará).
The central region of the country continues to concentrate the most critical areas, with the drought persisting in the corridor that encompasses parts of the Southeast (Minas Gerais and São Paulo), Midwest (Goiás and Mato Grosso), Northeast (Bahia and Piauí), and North (Tocantins and Pará).Figure 2. Integrated Drought Index (IDI) for the month of September 2025 on the 3-month scale (IDI3, left) (a) and 6-month scale (IDI6, right) (b). Forecast of the Integrated Drought Index (IDI) for the month of October 2025 on the 3-month scale (c).
Projections from the Integrated Drought Index (IIS-3) for the end of October 2025 indicate a reduction in the number of municipalities experiencing moderate to extreme drought, signaling a trend towards easing drought conditions across the country ( Figure 2c ).
The description of the IIS estimate and the assessment of drought impacts at the national level and also on family farming can be consulted, respectively:
Drought Monitoring and Impacts Bulletin in Brazil.
RiSAF – Drought Risk Bulletin for Family Farming
We invite you to contribute information about the impacts of droughts in your region through the Drought Impact Registration and Assessment Form.
Impacts of Drought on Water Resources
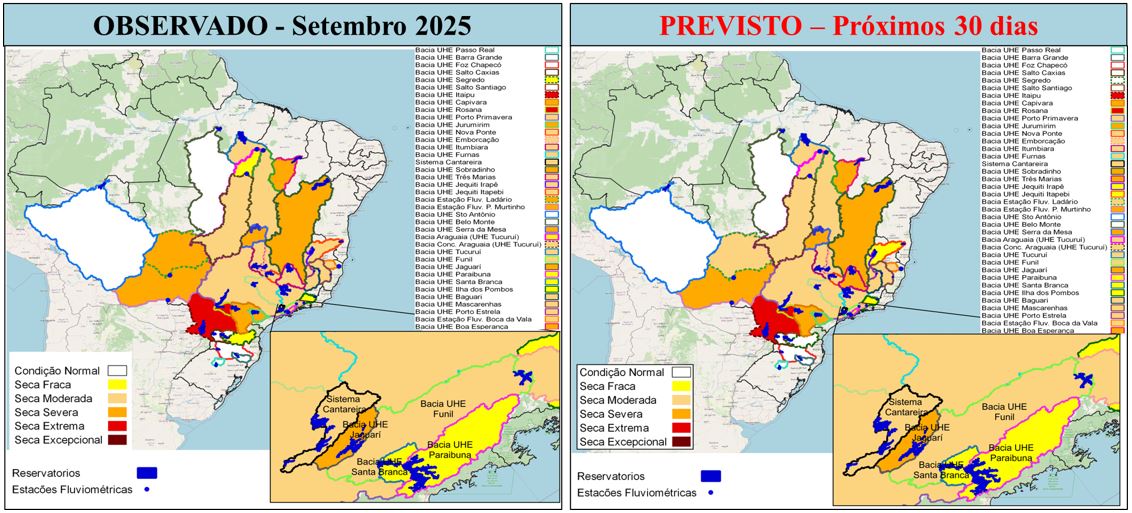
The Standardized Bivariate Precipitation-Runoff Index (TSI) allows for the characterization and prediction of hydrological droughts in the main river basins that feed the country’s main hydroelectric power plants (HPPs), as well as the basins associated with water supply and navigability ( Figure 3 ).
In the Southeast and South regions, the Cantareira System showed a weakening of the drought, going from severe to moderate. In the sub-basin feeding the Jaguari Hydroelectric Plant, the most critical of the Paraíba do Sul River, the drought weakened from extreme to severe. In the Paranapanema River, the sub-basins of the Jurumirim and Capivara Hydroelectric Plants regressed from extreme to severe, while the Rosana Hydroelectric Plant maintained a stable condition of extreme drought. In Itaipu, the condition also remained extreme.
In the Central-West region, the Serra da Mesa hydroelectric dam basin (Tocantins River) recorded severe drought, after experiencing extreme conditions the previous month. The Paraguay River basins, at the Porto Murtinho and Ladário stations, maintained severe drought, an improvement compared to the extreme conditions observed previously, although significant water deficits accumulated in recent years still persist.
In the Northeast region, the basins of the Sobradinho (São Francisco River) and Boa Esperança (Parnaíba River) hydroelectric power plants remained in a state of severe drought.
According to forecasts for October 2025, the basins with the most critical drought conditions — such as those of the Paraná River (Itaipu and Paranapanema), lower Paraguay River (Ladário), middle and lower São Francisco River (Sobradinho), headwaters of the Tocantins River (Serra da Mesa), and Parnaíba River — are expected to remain stable, without significant recovery.Figure 3. Bivariate Drought Index (Rainfall-Runoff) – TSI 6 and 12 for the month of September (observed, left) and October 2025 (forecast, right). The colored boundaries represent the main monitored basins across the country with their respective drought classes (ranging from exceptional to weak drought) and the condition within normality. Source of observed data between January 1981 and September 2025: Precipitation (CHIRPS); and Runoff (National Water and Basic Sanitation Agency – ANA/National Electric System Operator – ONS). Source of predicted precipitation data for May: Climate Forecast System (CFS).Get More Information
For more detailed information, please consult the Impact Bulletin and also download the Impact Meeting presentation available for download at the links below.
Download the Impact Bulletin
. Download the Impact Meeting presentation . Watch the recording of the Impact Meeting.
Click here to register your email and receive an invitation to the Impact Meeting. Your participation is very important!
Important Notes
1. Reports with more detailed information on the current situation of the main water reserves and drought conditions throughout the country, as well as hydrological projections and possible drought impact scenarios, are available and updated on the Cemaden website ( https://www.gov.br/cemaden/pt-br ).
2. The information/products presented may not be used for commercial purposes, copied in whole or in part for reproduction in media, without the express authorization of Cemaden/MCTI and other bodies with which Cemaden maintains partnerships. Users must always cite the source of the information/data as Cemaden/MCTI. We emphasize that the generation and dissemination of information/products consider criteria of data quality and consistency.
3. We also note that the data from the natural disaster monitoring network available via the Interactive Map on the Cemaden website have not undergone any processing; therefore, there may be inconsistencies in this data.
Responsible Team
Director: Regina Célia dos Santos Alvalá
Responsible Coordinator: José A. Marengo
Scientific Reviewer of this Edition: José A. Marengo
Collaborating Researchers: Adriana Cuartas, Ana Paula Cunha, Alan Pimentel, Elisângela Broedel, Fabiani Bender, Larissa Silva, Lidiane Costa, Márcia Guedes, Marcelo Seluchi, Marcelo Zeri, Rafael Luiz.CategoryScience and Technology
Related content
Presidency of the Republic
Civil House
Deputy Chief of Staff for Legal Affairs
LAW No. 12,608, OF 10 APRIL 2012.
| ValidityConversion of Provisional Measure No. 547 of 2011 | Establishes the National Policy for Civil Protection and Defense – PNPDEC; provides for the National System for Civil Protection and Defense – SINPDEC and the National Council for Civil Protection and Defense – CONPDEC; authorizes the creation of a disaster information and monitoring system; amends Laws No. 12,340, of December 1, 2010, No. 10,257, of July 10, 2001, No. 6,766, of December 19, 1979, No. 8,239, of October 4, 1991, and No. 9,394, of December 20, 1996; and provides other measures. |
Baixe documentos úteis sobre o Brasil ( Download useful documents on Brazil)
Institutions develop national plan for civil protection and defense.
The project encompasses prospective scenarios of natural hazards in Brazil.Alana Gandra – Reporter for Agência BrasilPublished on 04/26/2023 – 17:04Rio de Janeiro

Audio version
Five research and higher education institutions are participating in the development of the National Civil Protection and Defense Plan. The work is coordinated by the Pontifical Catholic University of Rio de Janeiro (PUC Rio), with the collaboration of the State University of Rio de Janeiro (Uerj), Oswaldo Cruz Foundation (Fiocruz), Methodist University of São Paulo (Umesp), and the Federal University of Recôncavo da Bahia (UFRB).

The project aims to establish guidelines, strategies, and goals to be implemented for risk and disaster management throughout the country, under the leadership of the National Secretariat for Civil Protection and Defense of the Ministry of Integration and Regional Development.
The project runs until December 31 of this year and the final document will be delivered to the secretariat. One of the results is the proposal of the National Civil Defense Policy, the coordinating professor of the Center for Studies and Research on Disasters (Cepedes), Francisco Dourado, informed Agência Brasil this Wednesday (26) . The implementation of the plan is scheduled for 2024, according to a decree signed by the ministries that make up the National System of Protection and Civil Defense.
The director of the Department of Coordination and Management of the SNPDC/MIDR, Karine Lopes, added, in an interview with Agência Brasil , that the implementation of the plan is scheduled to take place in 2024, by decree signed by several ministries that make up the National System of Civil Protection and Defense.
Professor Adriana Leiras, from the Department of Industrial Engineering at PUC Rio, said that the project encompasses the different phases of civil defense action, ranging from prevention, through mitigation, preparedness, response, and disaster recovery. “The project will encompass all these stages,” she stated.
Scenarios
UERJ (Rio de Janeiro State University) was responsible for creating prospective scenarios of natural hazards in Brazil, that is, risk scenarios for the country, considering the horizon up to 2030. “Based on these scenarios, other products will be developed. We will see what the main threats are in Brazil.”
Professor Francisco Dourado listed landslides, floods, gales, hailstorms, and others among them. “We have a list of 12 of the most significant threats that occur. Based on this, we will create scenarios where, in addition to identifying the situation in Brazil regarding disasters, we will conduct studies to see how these threats will behave in the future.”
The outlook for some threats is one of increase, stated the professor from Uerj. “If the amount of rainfall increases, the number of landslides and floods will also increase. Conversely, if there is a drought problem in that region, it will tend to decrease.”
Conversely, if rainfall decreases in drought-stricken regions, the drought is expected to become more prolonged. UERJ has 120 days to present its conclusions on the risk scenarios. After that, principles and guidelines will begin to be defined for each of the areas of action of civil defense (prevention, mitigation, preparedness, response, and disaster recovery).
The professor from PUC Rio explained that the ultimate goal is to have a plan that generates strategies, guidelines, and principles that can be followed at the federal level, but that also provide direction for states and municipalities, within the context of risk and disaster reduction.
Along with the final proposal, the dissemination strategy for this national plan and training proposals for civil protection and defense agencies on the plan will be delivered, Adriana Leiras emphasized. In addition to coordinating the overall project, PUC Rio is responsible for the products focused on each of the aforementioned areas of action.
Responsibilities
Umesp will be responsible for the risk communication aspects of the project and for communicating the National Civil Protection and Defense Plan to the press. UFRB is coordinating the entire participatory process, aiming to involve different stakeholders throughout the development of the national plan proposal. Francisco Dourado added that this participatory process encompasses not only civil society but also other segments, such as researchers from other universities and civil defense technicians from across the country.
Fiocruz was put responsible for defining intersectoral public policies. “We want to get everyone working towards risk and disaster management. Fiocruz is responsible for this interface between different agencies and ministries to understand their actions and include them in the national plan,” said Adriana. In addition to coordinating the work, PUC Rio will work on analyzing the impacts that prospective scenarios may cause in the future.
Adriana Leiras reported that alignment meetings are currently being held with the different sectoral committees. She highlighted that the final proposal will consider the existing and ongoing work at the National Civil Defense Secretariat to contribute to the generation of risk scenarios.
Validation
Karine Lopes highlighted that the plan is a strategic project of the National Secretariat for Civil Protection and Defense. The director of the Department of Articulation and Management of the SNPDC/MIDR recalled that, thanks to the partnership with the United Nations Development Programme (UNDP), this pool of universities, led by PUC Rio, was contracted.
“Upon completion of the contract, the expectation is to have a plan proposal already validated with society and other colleagues in the National System of Civil Protection and Defense, which is made up of federal, state, and municipal government agencies working in risk and disaster management in Brazil, as well as organized civil society, the private sector, and universities,” stated Karine. She believes that building the plan in an inclusive and participatory way can change the reality of Brazil.
Professor Francisco Dourado, from UERJ (Rio de Janeiro State University), argued that it would be very important for the Brazilian population to be aware of what is being done. “It is up to us, opinion leaders, to raise awareness and show people that they have responsibilities regarding what happens. Those who don’t know, don’t care,” said the professor. The idea is to bring knowledge to the population so that they can participate, along with researchers, in the development of the national plan.
For Karine Lopes, everyone is responsible. “This is a matter of capacity building, which will be included in all areas of this work. It’s not just about highlighting the importance of civil protection and defense policy when a disaster occurs, but rather about using the principle that civil defense is all of us in small, routine actions as citizens, as professionals, and also in politics and the management of public affairs.”
According to the director, the citizen is a fundamental part of the process. Therefore, the plan is being built to be participatory and inclusive. “So that the citizen has this representation of the diversity of what constitutes national culture and that, at the end of this process, they change their perspective on what constitutes risk.”