Methodology, Tools, Guidelines, and Implementation of Impact-Based Forecasting (IBF) for Mongolia (New Methodology)
Design and implementation by – Z M Sajjadul Islam, UNDP – International Consultant(Team Leader)
(This document is legally copyrighted; for any use of this document/any part of it, please mention the copyright of the author and the organization )
Acronym
AI Artificial Intelligence
ALAGaC/ Administration of Land Affairs, Geodesy and Cartography
ALAMGaC Agency for Land Administration and Management, Geodesy and Cartography
AWS Automatic Weather Station
5W Who will do what, where, when, and how
BTS Base transceiver station
CRVA climate risk and vulnerability assessment
CSV Excel file comma-separated values
CAP Common Alerting Protocol
CBO/CSO Community-based organization / Community services organizations
CMA, China Meteorological Administration
IBFWS Impact-based Forecast and Warning Services
CRVA Climate Risk and Vulnerability Assessment
DIMA National Rangeland Monitoring Database
EM-DAT Emergency Events Database
DCPC Data Collection and Processing Center
DTM/DEM Digital Terrain Models (DTM)/ Digital Elevation Models (DEM)
EAP early action protocol
EOC Emergency Operations Center
FAO Food and Agriculture Organization
AM/FM Radio Amplitude Modulation/Frequency Modulation
FBF forecast based Financing
FTP File Transfer Protocol
FGD Focus Group Discussion
GIS Geographic Information System
GPS Global Positioning System
HCT Humanitarian Country Team
HPC high processing power computing
IBF impact-based forecasting
ICS Incidence Command System
ICT Information and Communication Technology
IFRC International Federation of Red Cross and Red
IM Information Management
IP Internet Protocol
I-NGOs International /National Non-Governmental Organization
IRIMHE Information and Research Institute of Meteorology, Hydrology, and Environment
IVR Interactive Voice Response
JMA, Japan Meteorological Agency
KMA Korea Meteorological Administration
KII Key Informant Interviews
KML/KMZ Keyhole Markup Language
LEMA Local Emergency Management Agency
L & D Loss and Damage
MET Ministry of Environment and Tourism
MIS Management Information System
MHEWS multi-hazard early warning system
MODIS Moderate Resolution Imaging Spectroradiometer
MoED Ministry of Economy and Development
MOU Memorandum of understanding
MoFALI Ministry of Food, Agriculture and Light Industry
MRCS Mongolian Red Cross Society
NAMEM National Agency Meteorology and the Environmental Monitoring
NDVI Normalized difference vegetation index
NEC National Emergency Commission
NEMA National Emergency Management Agency
NMHS National Meteorological and Hydrological Services
NOAA National Oceanic and Atmospheric Administration
ODBC/JDBC Open Database Connectivity/ Java Database Connectivity
PDNA post-disaster damage, loss and needs assessment
NSO National statistics office
PIU Project Implementation Unit
PSTN Public switched telephone network
REST RESTful Application Programming Interface( API)
RIMES Regional Integrated Early Warning System for Africa and Asia
R & D Research & Development
SMS Short Message/Messaging Service
SME Small and Medium Enterprise
SoD standing orders on disaster
TWG Technical Working Group
WCS Web Coverage Services
WMS Web Map Service
WFS Web Feature Service
WPS Web programming service
UHF Ultra-high frequency
UNDP United Nations Development Programme
UNEP United Nations Environment Programme
UNFPA United Nations Population Fund
UNICEF United Nations International Children’s Emergency Fund
VHF Very high frequency
WFP UN World Food Program
WMO World Meteorological Organization
Table of Contents
Contents
1.0 Chapter : Introduction of Impact-Based Forecasting : 7
1.1 Importance of developing an integrated IBF platform : 7
1.3 The expected benefits of an integrated IBF platform: 13
2.0 Chapter: Stakeholder Partnership & Communication. 13
2.1 Rationale of Partnership ( both formal and virtual context) : 14
2.2 Data Coordination and Exchange Mechanism.. 15
2.3 Mandating partnership for data coordination, exchange, and risk communication. 16
2. 4 Technical Working Group for forecast Impact analysis : 24
2.5 Process of translating traditional forecast/weather outlook to impact forecasts : 49
2.6 Defined roles of partners during multi-hazard emergencies : 53
2.7 Partnership capacity building Process : 65
2.7.1 Organize regular Workshop/Consultation/Seminar/Meetings to improve service delivery: 65
2.7.2 Removing the Barriers to partnership building : 65
2.7.4 Improving IBF and warning systems efficiency and Efficacy. 66
3.0 Chapter: ICT Structures of integrated IBF Platform : 67
3.1 Implementation of Opensource Geospatial Platform : 67
3.1.1 Component of Opensource Geospatial Platform: 67
3.1.2 Installation of Geoserver : 69
3.1.3 Anchoring google mapping tools : 69
3.1.4 Installation and Configuring Surveying Apps. 69
3.1.6 Implementing Web converting common alerting protocol (CAP ) Hub : 70
3.2 Rationale of integrating ICT with the IBF platform : 71
3.3 Software & Tools Proposed for the ICT-integrated IBF Platform.. 72
3.4.1 Data workflow and data archive structures ( at IBF central level ) : 74
3.4.2 Integrated IBF ICT system : 75
3.4.3 Centralization of Database Archive and Services by IBF Platform.. 77
3.4.2.1 Develop databases with PostgreSQL server : 78
3.4.2.2 Impact forecast manufacturing tools, input datasets, and Process: 82
4.0 Chapter: Data Coordination and Exchange Mechanisms. 85
4.1 Data Coordination and Exchange Mechanisms at Aimag level : 86
5.0 Chapter : Aimag Emergency Operations Center (EOC) / Situation Room.. 94
5.1 Mandating an Emergency Operations Center (EOC) / Situation Room at the Aimag Center: 95
5.2 Aimag level NAMEM human resources : 95
5.3 Structure of the Aimag EOC / Situation Room.. 96
5.4 Functions of EOC / Situation Room : 97
5.4.1 Technical Functions of EOC / Situation Room : 98
6.0 Chapter : IBF Forecasting Process. 102
6.3 IBF preparation and forecasting process (New methodology) : 105
6.4 Converting traditional forecast to IBF. 123
6.4.1 Analyze impacts over the seasonal forecasts : 125
6.4.2 Processing monthly IBF : 125
6.4.3 Preparing medium-range Forecast : 128
6.4.4 Preparing short range Forecast : 129
6.4.5 The short-range forecasts usability : 130
6.5 Short range impact forecast preparation. 132
7.0 Chapter : Operational Forecasts. 134
8.0 Chapter : The multi-hazard early warning system.. 138
8. 1 Improved and hybrid weather observation mechanism : 141
8.2. Process of developing an Early Warning : 142
8.3 The multi-hazard early warning process: 144
8.4 Anchoring NEMA Early Warning System with IBF: 145
8.5 Integrated IBF, Warnings, Alerting, and energy hazard early warnings & Advisories : 145
8.6 Convective weather condition-induced hazards early warning : 151
8.7 Convective weather condition screening mechanism.. 155
8.8 Strong/Damaging Wind induced hazards warning : 159
8.9 Hazardous winter weather early warning : 162
8.10 Template: Winter weather emergency advisory. 165
8.11 IBF Flood Impact Forecasting: 166
9.0 Chapter: Impact Forecasting and Warning for Livestock Sector : 169
9.1 Impact analysis methodology : 170
9.2 Risk repository development process : 177
9.3 Advisory on Integrated Pasture Monitoring System: 185
9.3 Alert and warning services for livestock & Crop agriculture. 186
9.5 Develop dzud risk profile : 186
9.6 Web-based MIS system for Dzud risk management : 187
9.7 Develop Dzud Early warning protocol. 189
[3] https://developers.google.com/public-alerts/reference/google-cap-requirements
[4] Proposed IBF web-based platform ( www.weather.gov.mn , www.ibf.gov.mn)
Executive Summary:
Mongolia faces rapidly evolving and highly variable weather and climate risks driven by complex interactions between global climate perturbations and diverse local geographic and climatic conditions, including the Gobi Desert, steppe ecosystems, mountainous terrain, and pronounced diurnal variability. These dynamics frequently generate high-impact hazards such as Dzud, severe winter storms, blizzards, damaging winds, drought, floods and flash floods, dust storms, and convective storms resulting in significant loss and damage to livelihoods, infrastructure, and socio-economic development. The agriculture and livestock sector, a major contributor to national GDP and rural well-being, is among the most affected, underscoring the need for actionable, last-mile climate information services that strengthen preparedness and enable early action.
This initiative outlines the development methodology, tools, and guidelines for Impact-Based Forecasting (IBF) tailored to Mongolia’s multi-hazard and climate risk environment, with a focus on vulnerable livestock, crop agriculture, and livelihood systems. The combined agricultural sector (livestock and crops) contributed 18.3 percent of GDP in 2022, yet increasingly variable and intensified extreme weather, particularly Dzud, continues to undermine rural, livelihood-based economies. At present, Mongolia’s early warning ecosystem remains insufficiently integrated and operationalized to consistently support the livestock sector in preparing for, responding to, and recovering from Dzud and other climate-induced disasters through end-to-end services that combine forecasting, warning, and common alerting.
The proposed IBF system is designed to address structural, process, and forecast product development gaps within NAMEM/IRIMHE by establishing a robust, ICT-enabled integrated platform. It also introduces a formal mechanism to link and mandate engagement from key partner institutions, enabling interactive and routine contributions to the system. Operationally, the IBF approach aligns forecasts of impending high-impact weather with baseline exposure, risk, and vulnerability information for elements on the ground, enabling structured impact estimation and targeted decision support.
Impact-Based Forecasting represents a paradigm shift from communicating “what the weather will be” to “what the weather will do.” It integrates hazard forecasts with exposure and vulnerability datasets, alongside real-time incident and situational evidence, to deliver decision-relevant advisories, warnings, and multi-hazard early warning services. For Mongolia, an integrated IBF system is envisaged as a one-stop platform aligned with the WMO transition toward impact forecasting, supporting implementation of the Sendai Framework and strengthening the availability and use of disaster risk information in climate-frontline contexts. The system is intended to enhance the utility of forecasts, enable early action protocols, and support Forecast-based Financing (FbF) by linking forecast thresholds to anticipatory actions and resource mobilization.
Operationally, the IBF value chain links: (i) seasonal and sub-seasonal outlook interpretation using climate normals and anomaly analysis; (ii) real-time monitoring and nowcasting; (iii) sector-specific impact analysis through threshold-based overlays of hazards with exposure and vulnerability datasets; (iv) dissemination of tailored advisories and warnings, including CAP-compatible alerting where applicable; and (v) continuous feedback, verification, and post-event learning through incident and loss-and-damage repositories. The approach emphasizes last-mile reach by enabling remote herders, volunteers, and sector technicians to report observations offline and transmit them when connectivity becomes available, supported by standardized SOPs, quality control, and validation protocols.
To decentralize services and ensure rapid, localized decision-making, the framework proposes operationalizing Aimag-level Emergency Operations Centers (EOC)/Situation Rooms jointly led by NAMEM and NEMA (LEMA), with participation from MRCS and sector departments. These EOCs would function as hubs for localized CRVA, risk repository development, impact interpretation, incident tracking, ICS/IAP coordination, and communication with the national IBF platform in Ulaanbaatar, particularly critical during extreme events when physical access is constrained, and emergency telecommunications may be the only reliable connectivity.
In summary, Impact-Based Forecasting for Mongolia offers a scalable and integrated pathway to translate complex hazards into actionable decisions. By strengthening observation networks, building climate risk and vulnerability baselines, enabling geospatial impact analysis, institutionalizing multi-stakeholder coordination, and linking forecasts to anticipatory actions and financing triggers, the proposed IBF system aims to reduce loss and damage, protect livelihoods and critical infrastructure, and support risk-informed development planning across Mongolia’s diverse climatic regions.
1.0 Chapter : Introduction of Impact-Based Forecasting :
The impact-based forecasting (IBF) is a technical & operational shift from traditional forecasting (‘what the weather will be ) to impact forecasting (‘what the weather can do’). It encompasses transformative and structural changes from the traditional forecasts to IT database & GIS tool-based analytics of color-coded thresholds of impacts, exposure, risks, vulnerabilities of the ground, anticipatory losses & damages likely to be impending over the forecast lead time. Therefore, the humanitarian community and vulnerable sectors will be informed about the impact level and be able to develop an early action protocol (EAP) for better preparedness. ICT-driven integrated impact-based weather forecasting, warning, alerting, and multi-hazard early warning system( MHEWS) is a WMO’s new approach to coming up with a one-stop solution to improved weather and climate information services starting from baseline climate risk and vulnerability assessment, risk repository, and atlas preparation so that any impending hazards weather events being well screened, predicted with spatiotemporal scale and anticipatory loss & damages (L & D) being well advised over the forecast lead-time until hazardous weather events being dissipated.
Traditional weather forecasting typically offers a limited view of conditions such as temperature, precipitation, wind speed, and other atmospheric variables. Impact-Based Forecasting (IBF) goes beyond this by explaining what those conditions are likely to do on the ground. For instance, an IBF forecast can indicate the expected frequency and intensity of hazardous events, the impact thresholds at relevant spatial and temporal scales, and the anticipated risks and vulnerabilities along with the likely loss and damages (L&D). It can also inform the design of an Early Action Protocol (EAP), support Early Warning Early Action (EWEA) through detailed contingency planning, and guide anticipatory budgeting to strengthen preparedness and response.
.
1.1 Importance of developing an integrated IBF platform :
Mongolia’s diverse and rapidly changing weather conditions make it essential to move beyond conventional forecasting. The proposed Impact-Based Forecasting (IBF) system is designed to address structural, process, and forecast product development gaps within NAMEM/IRIMHE by establishing a robust, integrated IBF platform. This methodology also creates a mechanism to formally link and require engagement from key partner institutions, enabling interactive contributions to the system.
Operationally, the IBF approach is intended to align and integrate impact calculations for impending high-impact weather with existing baseline risks and vulnerabilities of exposed elements on the ground.
Key components and requirements of the IBF process include:
- Core inputs: A readily available, sector-specific repository of baseline risk and vulnerability assessments; a corresponding database of risk and vulnerability attributes; and a GIS-enabled risk atlas to support forecast impact analysis.
- Real-time monitoring interface: An ICT-enabled platform for tracking hazardous conditions through crowdsourcing and hybrid ICT-based surface weather observations, including automated systems.
- Risk-informed sectoral planning tools: Weather- and climate-risk planning tools tailored to sector-specific needs.
- Service dashboard: A dashboard providing customized impending weather and climate information services to support sectoral planning and decision-making.
- Anticipatory action modules: Early Action Protocols (EAP), early warning–early action (EWEA) planning, anticipatory loss and damage scenarios, and tools to support humanitarian response planning and budgeting.
- Threshold-based warning and CAP alerting: GIS-based functionality to analyze threshold triggers, generate impact-based warnings, and develop standardized alerting protocols when severe weather is likely to escalate into a disaster.
- Multi-hazard services and direct communication: Capacity to deliver multi-hazard impact-based forecasts and warnings, enabling NMHS agencies to communicate directly with vulnerable communities, sectors, and end users via group-based applications and provide situational updates to support common alerting.
- Structured decision-support information: An IBF information system that integrates impact forecasting, hazard warnings, and tailored exposure and vulnerability data to identify risk, support humanitarian decision-making, and enable early action that reduces loss of life and damages.
- Clear distinction from traditional forecasts: While traditional forecasts describe expected weather (e.g., “70 mm/hour rainfall at a given location”), IBF links that hazard to exposed elements and vulnerabilities translating the forecast into likely outcomes such as flooding and flash flooding impacts, threats to life, and damage to assets and infrastructure.
- Primary value proposition: IBF combines hazard forecasts (rainfall, wind, temperature extremes, etc.) with exposure (buildings, transport networks, population distribution) and vulnerability (susceptibility of people, property, and infrastructure), producing decision-relevant warnings.
- Societal benefit: By delivering an integrated, authoritative message across sectors and communities, IBF supports timely, appropriate action to protect lives and property.
1.2 Framework of Integrated Framework for Impact-Based Forecasting, Weather Warning and Alerting, and Multi-Hazard Early Warning Systems (MHEWS)
The integrated Impact-Based Forecasting (IBF) concept is designed to function as a one-stop platform for delivering weather and climate information services. In Mongolia, a robust IBF system would support the WMO-led global shift from traditional, hazard-only forecasting toward integrated impact forecasting that links prediction with warning, alerting, and people-centred Multi-Hazard Early Warning Systems (MHEWS), with strong emphasis on last-mile delivery to end users.
The proposed IBF system is also essential to advancing full implementation of the Sendai Framework, particularly by expanding access to MHEWS and strengthening the availability and operational use of disaster risk information and risk assessments in climate frontline contexts.
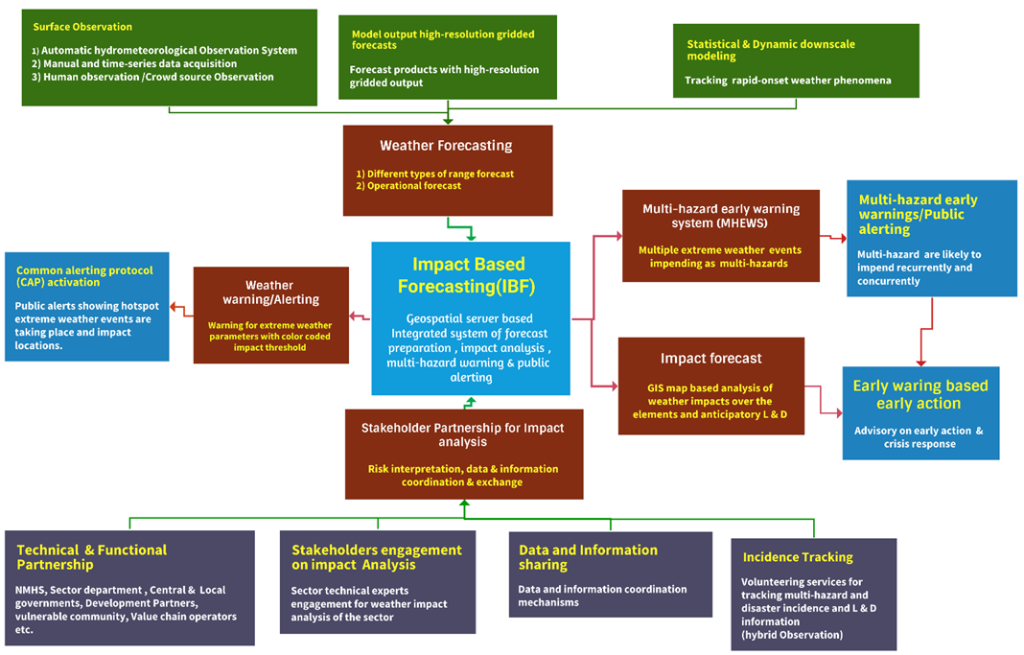
Figure 1: Framework of impact-based forecasting, warning, alerting, and MHEWS( Source: Z M Sajjadul Islam, UNDP-GCF)
- a) Key Components of the MHEWS Framework being integrated into IBF Platform :
- Surface observations
- Automatic hydrometeorological observation systems
- Manual observations and time-series data collection
- Human observations and crowdsourced reporting
- High-resolution forecast model outputs (gridded forecasts)
Forecast products with high-resolution gridded outputs
- High-resolution forecast model outputs (gridded forecasts)
- Statistical and dynamic downscaling
Tracking rapid-onset weather phenomena with high resolution forecast
- Statistical and dynamic downscaling
- Forecasting and integration – Weather forecasting
- Multiple forecast ranges (nowcasting, short-, medium-, and extended-range)
- Operational forecasting
- Geospatial Server integrated into IBF Platform
A geospatial-server-based integrated system for forecast production, impact analysis, multi-hazard warning, and public alerting
- Geospatial Server integrated into IBF Platform
- Warning, alerting, and response – Common Alerting Protocol (CAP) activation
Public alerts highlighting hotspots of ongoing or imminent extreme weather and affected locations, livestock herding camps, and integrated value chain operators.
- Warning, alerting, and response – Common Alerting Protocol (CAP) activation
- Weather warning and alerting
Warnings for extreme weather parameters using colour-coded impact thresholds
- Weather warning and alerting
- Multi-Hazard Early Warning System (MHEWS)
Multiple extreme weather events developing or expected concurrently as compound/multi-hazard risks
- Multi-Hazard Early Warning System (MHEWS)
- Multi-hazard early warnings and public alerting
Multi-hazard events may occur repeatedly and concurrently, requiring integrated public alerting
- Multi-hazard early warnings and public alerting
- Early warning–based early action
Actionable advisories to enable early action and crisis response management for the climate vulnerable sectors(agriculture, livestock, livelihood and other value chain sector )
- Early warning–based early action
- Impact analysis and coordination Impact forecast
GIS-based analysis of expected weather impacts on exposed elements, including anticipatory loss-and-damage considerations
- Impact analysis and coordination Impact forecast
- Stakeholder partnership for impact analysis
Risk interpretation, and data/information coordination and exchange
- Stakeholder partnership for impact analysis
- Interoperable National Meteorological-hydrological Services(NMHS) with sector-level technical experts integrated into IBF Platform
- Technical and functional partnerships
NEMA, LEMA, NMHS, Sector department( livestock, crop agriculture, water sector, hydrological, transport & communication, tourism, other value chain service providers of Mongolia ) technical experts, GIS & remote sensing specialists, sector ministries/departments; Academia, R & D Organization; central and local governments; development partners; vulnerable communities; value-chain operators
- Technical and functional partnerships
- Stakeholder engagement on impact analysis
Engagement of sector technical experts to assess and validate sector-specific weather impacts
- Stakeholder engagement on impact analysis
- Data and information sharing
Data and information coordination mechanisms
- Data and information sharing
- Incident tracking
Volunteer-supported tracking of multi-hazard events, disaster incidents, and loss-and-damage information (hybrid observation)
- Incident tracking
- key components of an Impact-Based Forecasting (IBF) framework—organized end-to-end from data inputs to last-mile action and learning.
- Risk knowledge and baseline risk information
- Multi-hazard risk, exposure, and vulnerability databases (CRVA, risk atlases, element inventories)
- Historical event and loss-and-damage repositories (hazard footprints, hotspots, impacts)
- Sector-specific risk profiles and impact thresholds aligned to local contexts (aimag/soum/bag)
- Monitoring, detection, and forecasting
- Integrated observation systems: manual stations, AWS, hydrological gauges, radar/satellite, and crowdsourced field reports
- Forecasting chain across timescales (nowcasting, short-range, sub-seasonal, seasonal) including ensemble guidance
- Data quality control, calibration, assimilation, and continuous forecast verification
- Impact assessment and decision-support analytics
- Hazard-to-impact translation using GIS overlays of forecasts with exposure and vulnerability layers
- Threshold-based impact classification (e.g., green/yellow/orange/red) by sector and element
- Compound and cascading risk logic (e.g., heavy rain + saturated soil → landslide/flash flood risk)
- Scenario-based anticipatory loss-and-damage estimation to inform early actions
- Warning generation and Common Alerting Protocol readiness
- Standardized warning products: watches, warnings, updates, and all-clear messages
- CAP-compatible alert creation and aggregation, including event metadata (severity, urgency, certainty, location)
- Message standards focused on “what will happen, where, when, likely impacts, and what to do”
- Dissemination and last-mile communication
- Multi-channel dissemination: IBF web platform (GeoNode/GeoServer), SMS/IVR/cell broadcast, radio/TV, social media, and community networks
- Two-way communication channels for receiving field verification and incident updates (Kobo/QField, GPS apps, WhatsApp/Telegram)
- Offline-capable reporting and delayed synchronization for hard-to-reach areas
- Preparedness and response capability
- Integration with Aimag EOC/Situation Rooms and Incident Command System (ICS) operations
- Pre-agreed Early Action Protocols (EAPs) linked to forecast thresholds (EWEA/FbF/AA)
- Coordination protocols for partners (NEMA/LEMA, MRCS, MoFALI, sector departments, HCT, I-NGOs)
- Governance, SOPs, and institutional coordination
- Clearly defined roles, responsibilities, and escalation procedures across national and local levels
- Data-sharing agreements, access controls, and operational SOPs for routine and emergency modes
- Regular coordination forums (TWGs, briefings, after-action reviews) for continuous improvement
- System sustainability, performance monitoring, and learning
- Monitoring of warning performance (timeliness, accuracy, reach, user comprehension, action taken)
- Post-event evaluation, model/threshold refinement, and knowledge management
- Sustainable resourcing for ICT hosting, observation networks, staffing, and capacity development
- Governance and institutional arrangements
- Clear mandates for NMHS, DRM authority, sector ministries, local governments, and humanitarian partners
- Defined coordination structure (e.g., Steering Committee + Technical Working Groups)
- Standard Operating Procedures (SOPs) for routine operations and emergencies
- Legal/data-sharing instruments (MoUs), roles, and escalation protocols
- Hazard monitoring and observation system
- Surface observation network (manual stations, AWS, hydrological gauges)
- Remote sensing and radar/satellite monitoring for rapid-onset hazards
- Crowdsourced and community observations (photos/videos + geolocation + simple weather parameters)
- Data quality control, calibration, metadata standards, and maintenance plans
- Forecast production and modeling chain
- NWP and ensemble forecasts (short range to seasonal)
- Nowcasting tools for rapidly developing weather (0–6/12 hours)
- Downscaling (statistical/dynamical) to operational grid resolutions suitable for local decisions
- Forecast verification and bias correction routines (continuous improvement loop)
- Exposure, vulnerability, and baseline risk information
- Climate Risk and Vulnerability Assessment (CRVA) database and risk atlas
- Sectoral exposure inventories (livestock, crops, water systems, infrastructure, services)
- Socio-economic vulnerability datasets (disaggregated where feasible)
- Historical event repository (hazard footprints, impacts, loss and damage)
- Impact modeling and threshold definition
- Impact thresholds by hazard and sector (color-coded: green/yellow/orange/red)
- Translation rules from meteorological variables to sector impacts (e.g., grazing barriers, water stress, flood impacts)
- Compound/ cascading risk logic (e.g., heavy rain + saturated soil → landslide risk)
- Trigger sets aligned to Early Action Protocols (EAPs) and financing decisions (FbF/AA)
- Geospatial analytics and decision-support products
- GIS overlay analysis: forecast hazards + exposure + vulnerability
- Automated production of: impact maps, affected-area lists, hotspot layers, sector advisories
- Standard templates for outlooks, operational forecasts, and verification briefs
- Spatial products at administrative levels (aimag/soum/bag) and priority assets (point-based)
- Integrated ICT platform and data services
- Central database servers (e.g., PostgreSQL/PostGIS) and data pipelines
- GeoNode/GeoServer for publishing, discovery, access control, and archiving
- OGC/REST services (WMS/WFS/WCS/REST API) for partners (ArcGIS/QGIS integration)
- Automated archiving/versioning of CSVs, shapefiles, maps, bulletins, and incident records
- Warning, alerting, and Common Alerting Protocol readiness
- Multi-channel warning pipeline (web dashboards, SMS/IVR/cell broadcast, radio/TV, social media)
- CAP-compatible alert generation and aggregation (where applicable)
- Message standards: “what, where, when, severity, likely impacts, actions”
- Update cascading hazard lifecycle (watch → warning → aleting → event situation update )
- Decentralized operations and last-mile delivery
- Aimag-level EOC/Situation Room functions for localized interpretation and coordination
- Incident Command System (ICS) integration: situation reporting, IAP support, coordination calls
- Community and volunteer networks for two-way information flow and field verification
- Offline-capable reporting tools (Kobo/QField/GPS apps) and protocols for validation
- Capacity building and operational readiness
- Training for forecasters, sector analysts, GIS/data engineers, and EOC staff
- Simulation drills and seasonal readiness exercises
- Guidance notes for sector impact interpretation and advisory writing
- Helpdesk/operations support for platform users and partners
- Feedback, evaluation, and continuous improvement
- Post-event reviews: what was forecast vs. what occurred vs. what impacts occurred
- User feedback loop from herders, farmers, sector agencies, responders
- Refinement of thresholds, exposure assumptions, and impact models
- Performance metrics for timeliness, reach, comprehension, and actionability
- Sustainability and financing linkages
- Integration with anticipatory action/FbF decision protocols and triggers
- Budgeting for observation networks, ICT hosting, maintenance, and staffing
- Partner contribution model for data updates and joint products
- Data governance for privacy, security, and controlled access where required
………………………………………………………………………………..
Please download full document in PDF Format
Please download in Word Document
Annexures for Impact-Based Forecasting Methodology tools, guidelines
Annexure 1 Checklist of elementsDownload
Annexure 1 Checklist of elementsDownload
Annexure 3 Input indictors and variables for livestock impact analysisDownload
Annexure 4 Herders Queries-Livestock managmentDownload
Annexure 5 GIS Data requisitionDownload
Annexure 6 Winter weather emergency advisoryDownload
Annexure 2 Stakeholder prepared databaseDownload
Copyright Notice: This summary is based on the technical frameworks and documents of the National Agency for Meteorology and Environmental Monitoring (NAMEM), the Information and Research Institute of Meteorology, Hydrology and Environment (IRIMHE) of Mongolia, and the Multi-hazard Early Warning System Design & Implementation Center (MHEWC). All rights to the original methodology and implementation guidelines are reserved by the author ( Z M Sajjadul Islam of UNDP Mongolia ) and the respective organizations.