Comprehensive CRVA & Multi-Hazard Risk Assessment
Developed by: Z M Sajjadul Islam
[ The copyright © 2026 Z M Sajjadul Islam, Advisor, Multi-Hazard Early Warning System Design and Implementation Center (MHEWC – www.mhewc.org www.glocs.org ). All rights reserved. Any material quoted, reproduced, adapted, or extracted from this technical strategy document must be properly cited and attributed to the author to avoid legal issues. Please call at +8801711979179, Email: zmsajjad@gmail.com ]
A Comprehensive Climate Risk and Vulnerability Assessment (CRVA) moves beyond static hazard maps to establish a dynamic, multi-layered spatial engine. It is the analytical foundation that allows local governments to shift from reactive disaster response to risk-informed, anticipatory planning.
At the highest level of technical implementation, a CRVA operationalizes the standard risk equation () by translating socioeconomic field data and meteorological models into interoperable GIS layers.
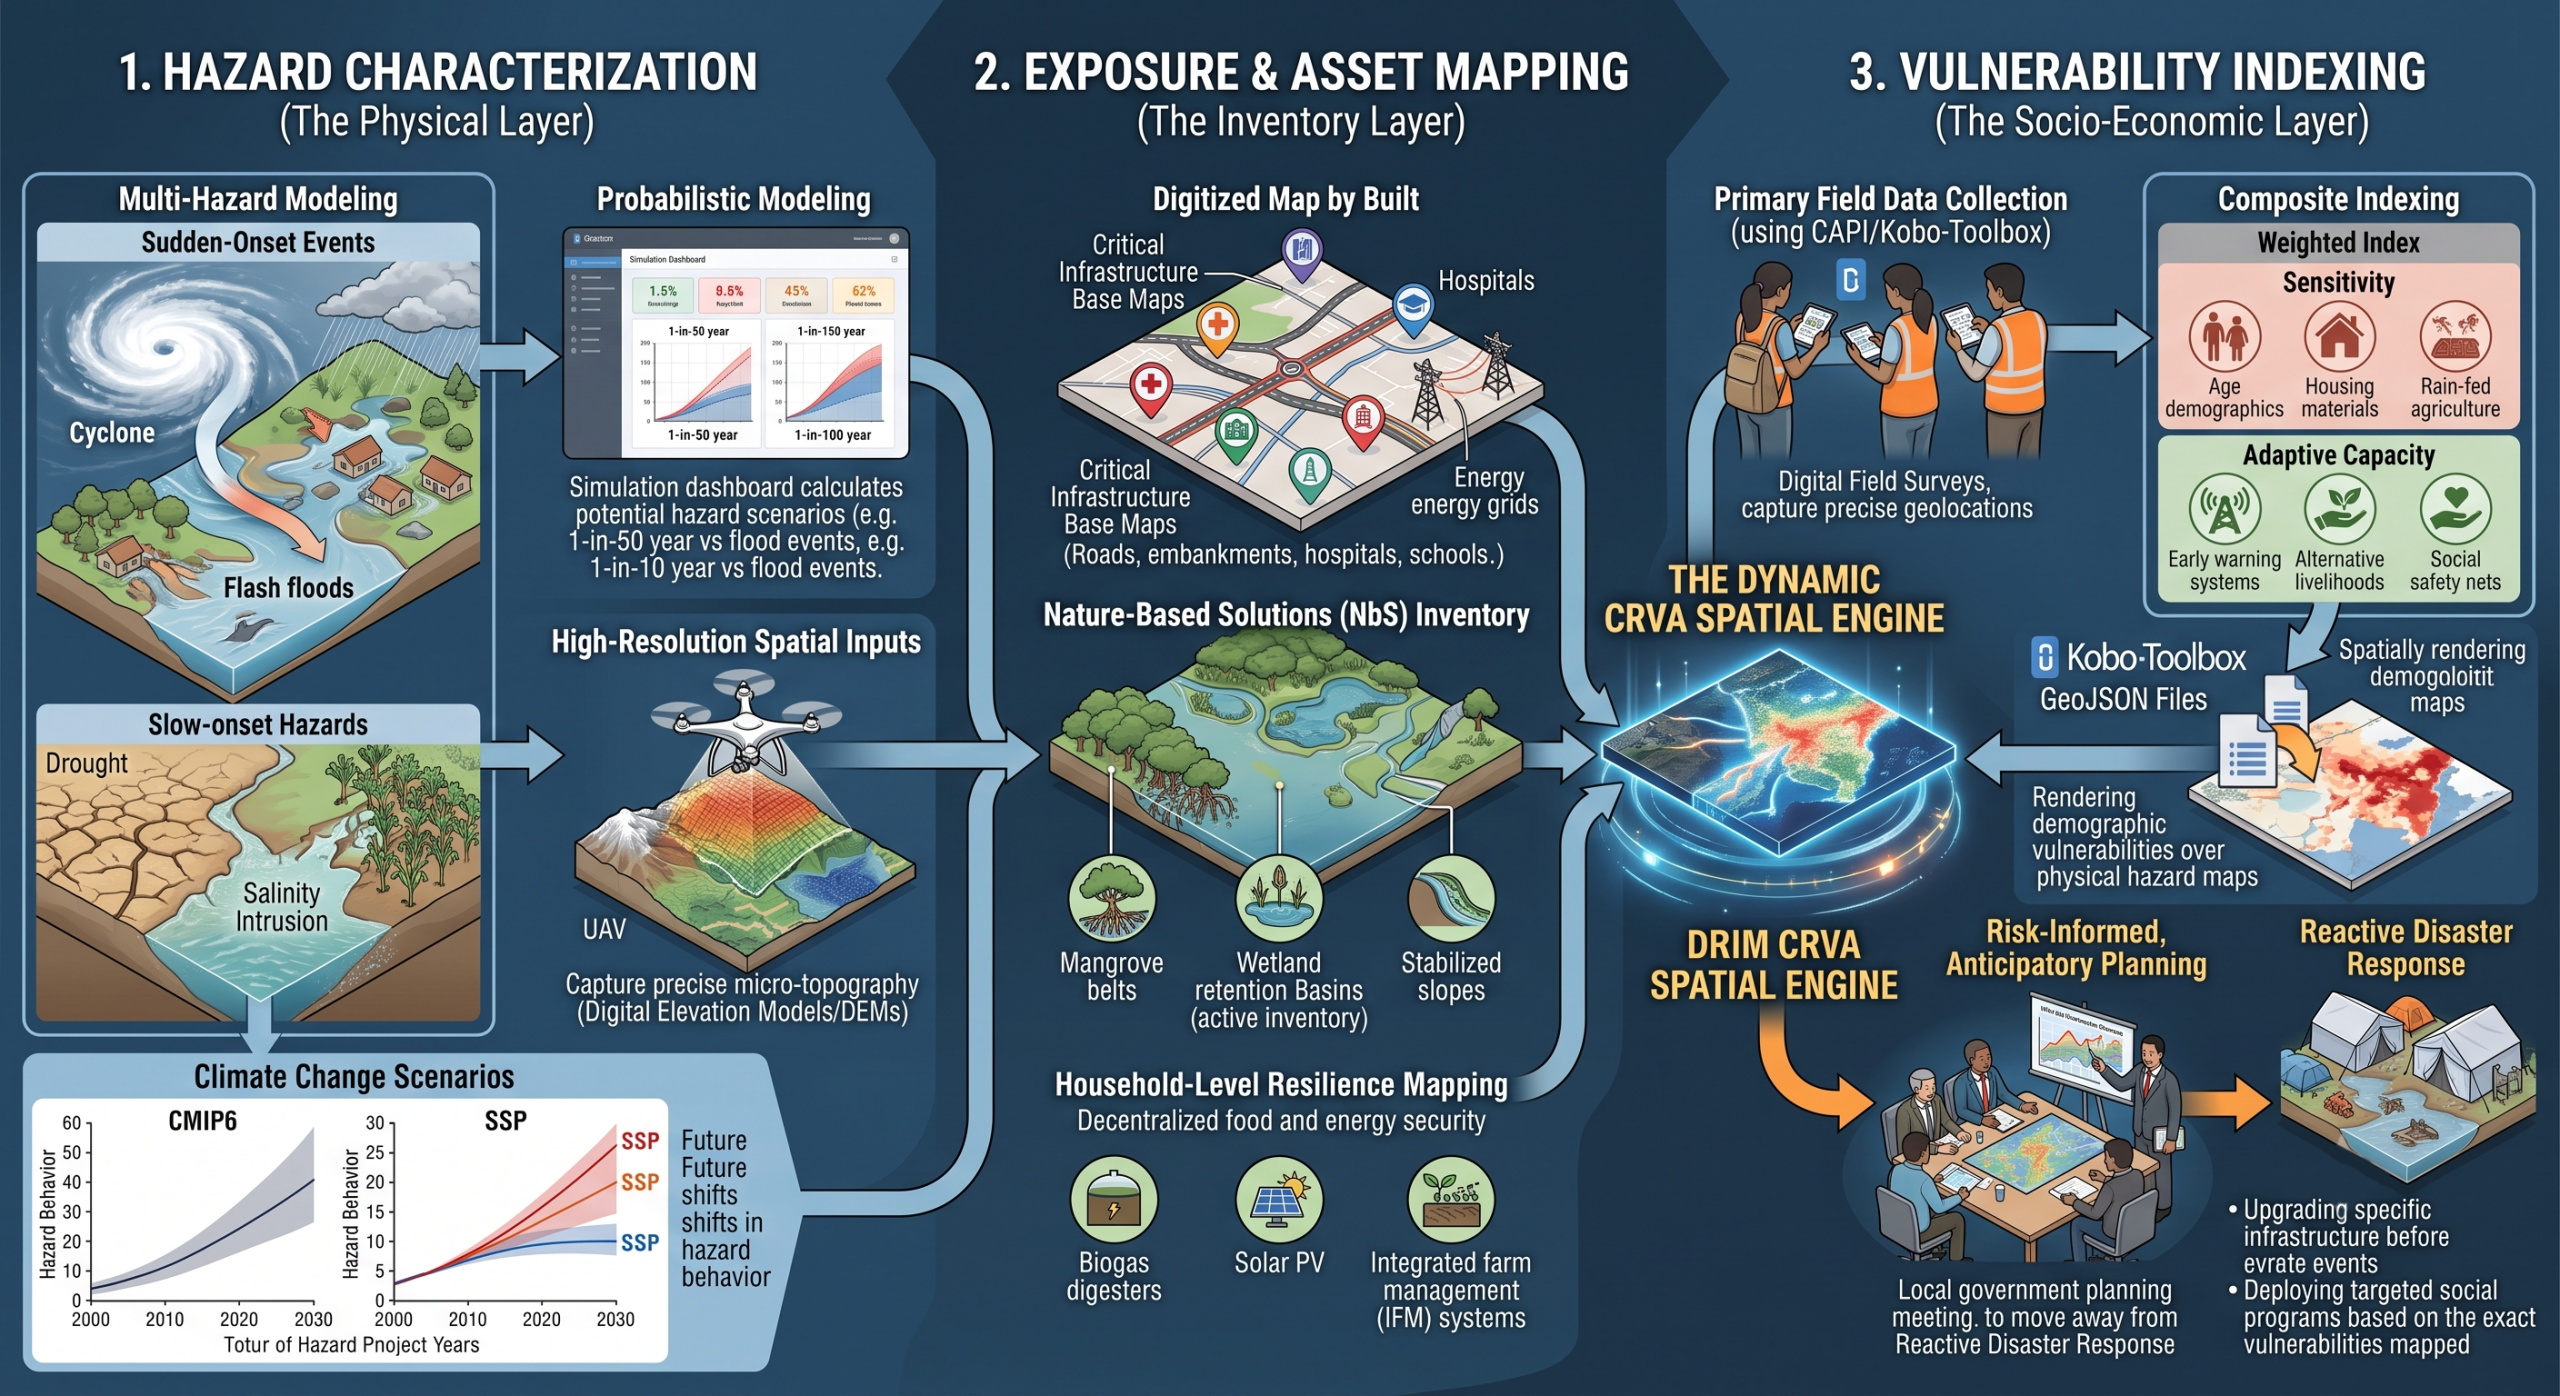
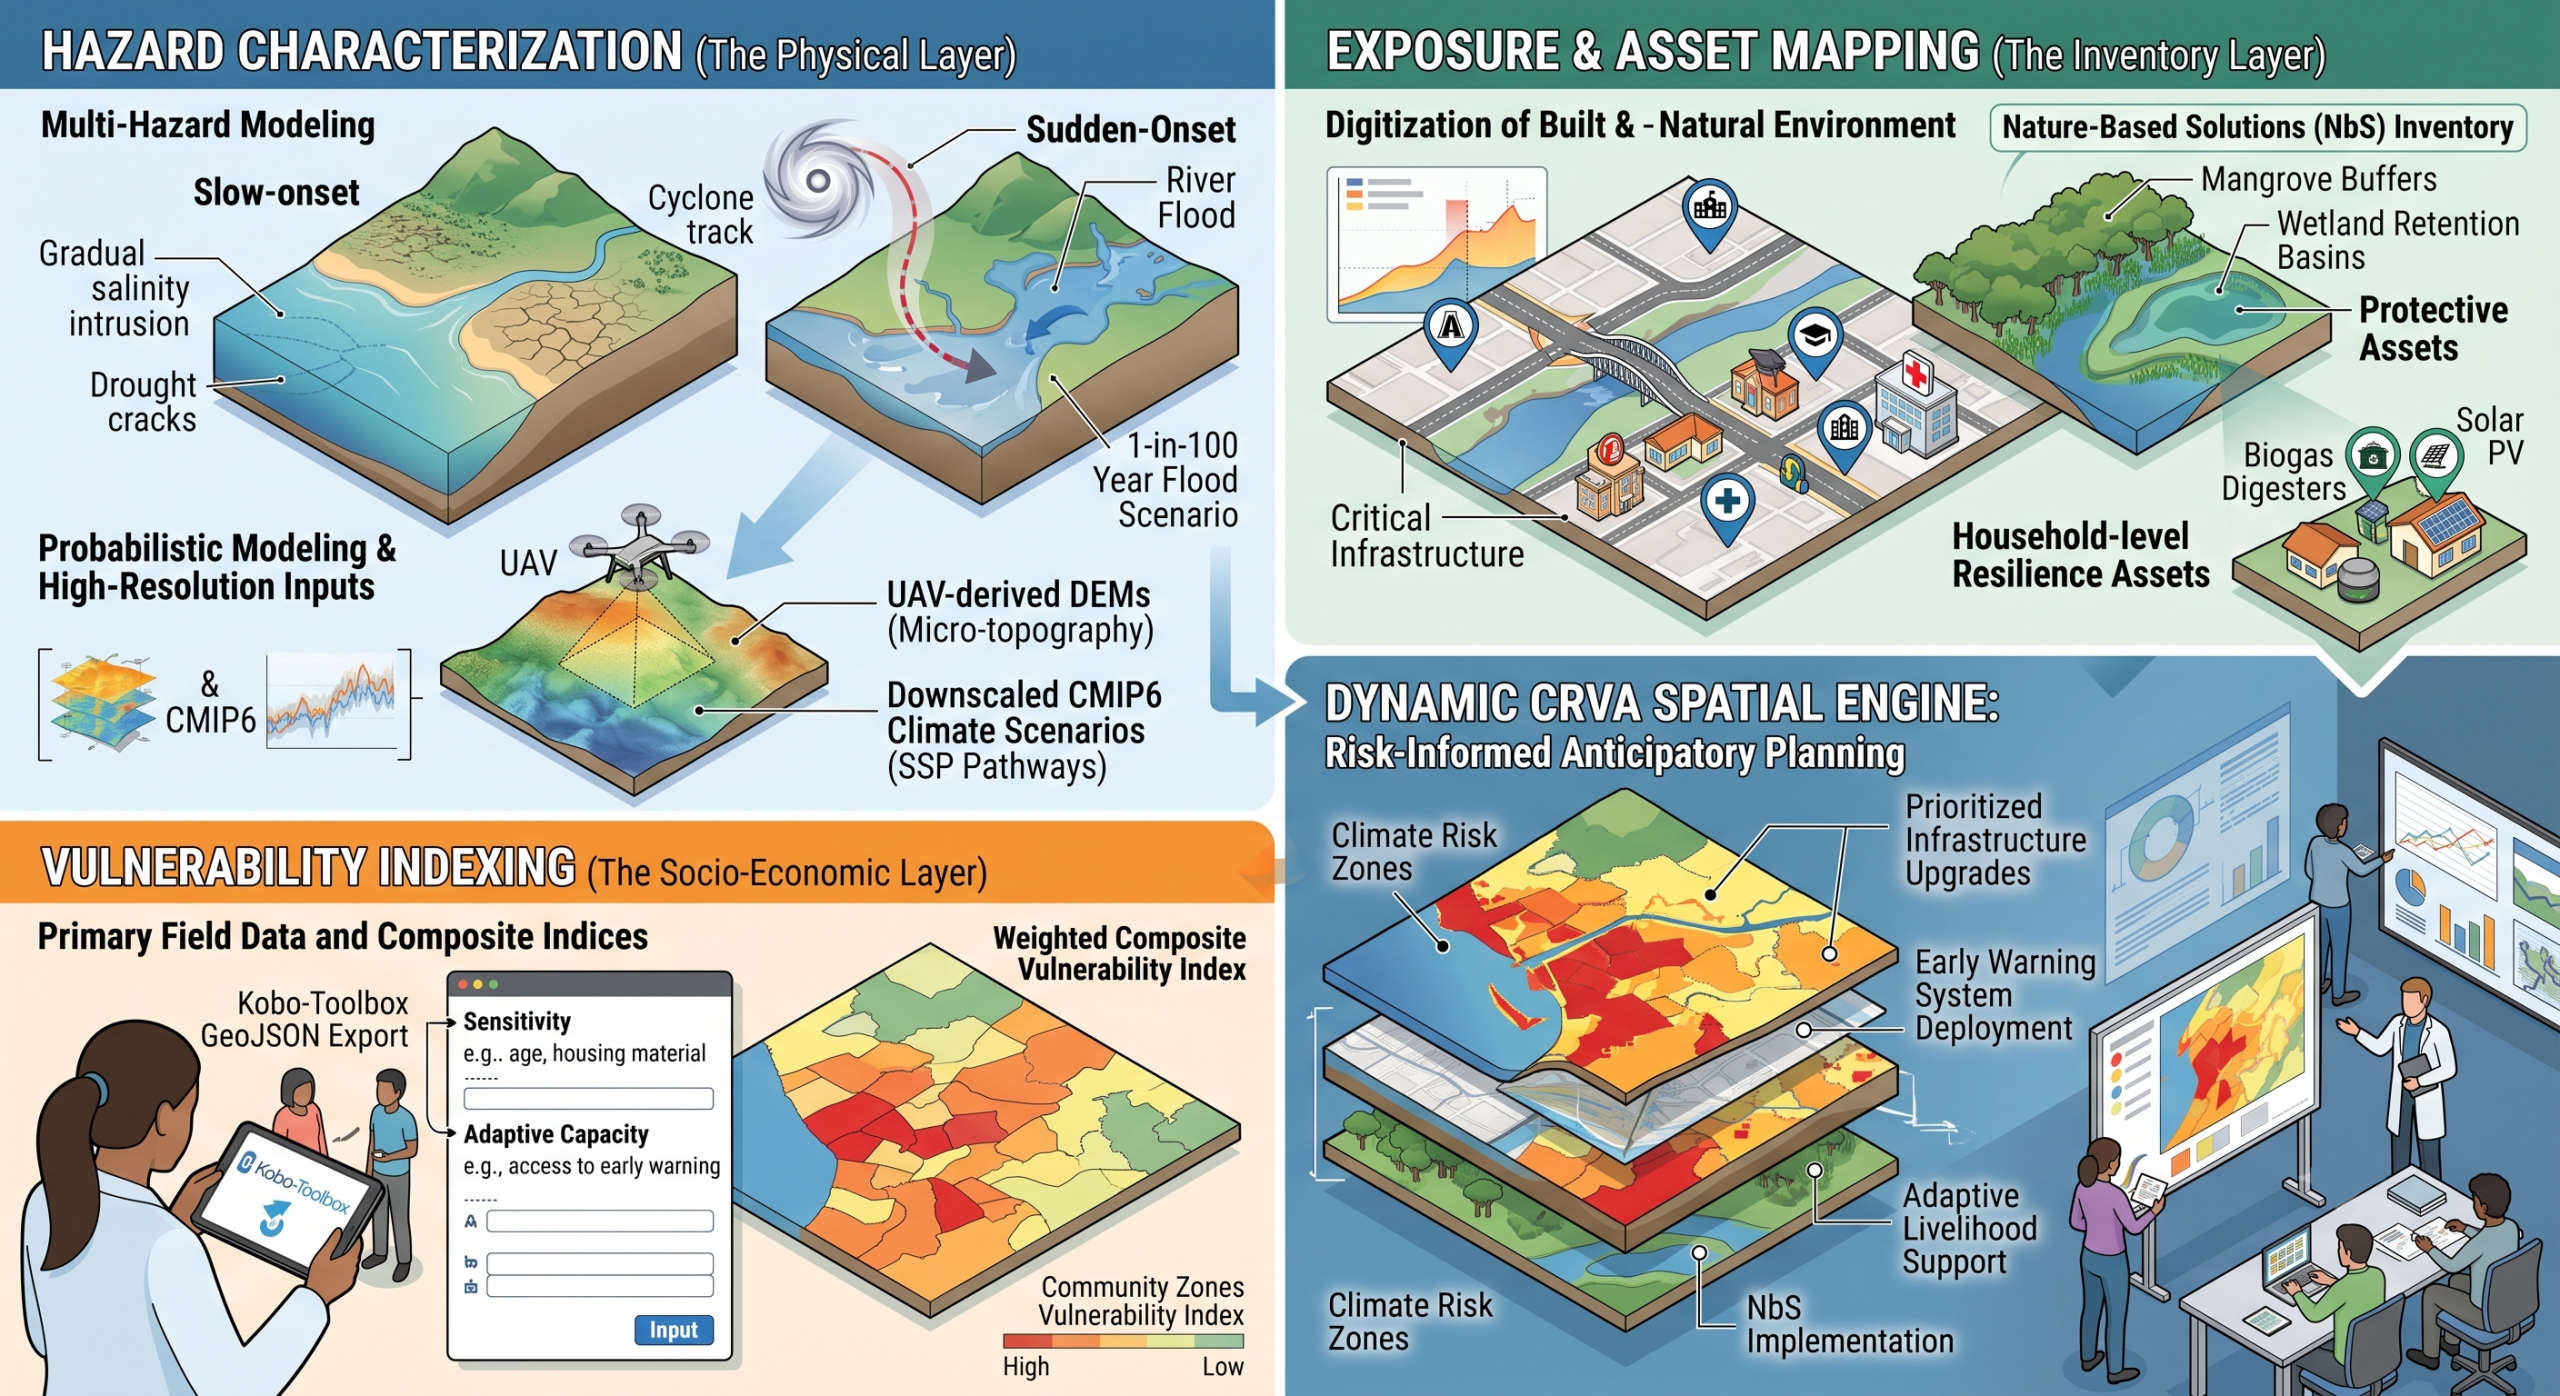
- Hazard Characterization (The Physical Layer)
The first step requires modeling the intensity, frequency, and spatial extent of both sudden-onset (cyclones, flash floods) and slow-onset (salinity intrusion, drought) hazards.
- Probabilistic Modeling: Rather than relying solely on historical damage, probabilistic models simulate thousands of potential hazard scenarios to calculate varying return periods (e.g., 1-in-50 year vs. 1-in-100 year flood events).
- High-Resolution Spatial Inputs: Macro-level Earth Observation (EO) data provides the baseline, but localized mapping requires high-resolution photogrammetry. UAVs (drones) are deployed to generate precise Digital Elevation Models (DEMs) and orthomosaics, capturing micro-topography critical for accurate flood inundation or storm surge modeling.
- Climate Change Scenarios: Hazard layers must be adjusted dynamically using localized downscaled climate models (such as CMIP6 data) to project future hazard behavior under different emission scenarios (SSP pathways).
- Exposure & Asset Mapping (The Inventory Layer)
Risk only materializes when people, infrastructure, or ecosystems are located within the hazard footprint. Exposure mapping digitizes the built and natural environment.
- Critical Infrastructure Base Maps: Utilizing GIS to map roads, embankments, hospitals, schools, and energy grids.
- Nature-Based Solutions (NbS) Inventory: Ecosystems are mapped as protective assets. Mangrove belts, wetland retention basins, and stabilized slopes are digitized as active infrastructure layers to assess their capacity to buffer hazard impacts.
- Household-Level Resilience Mapping: Capturing localized, climate-adaptive assets. For example, mapping nodes of decentralized food and energy security, such as households equipped with biogas digesters, solar PV, or integrated farm management (IFM) systems.
- Vulnerability Indexing (The Socio-Economic Layer)
Vulnerability determines the propensity of exposed assets and populations to suffer adverse effects. This is where primary field data intersects with spatial analytics.
- Composite Indexing: Creating a weighted index that measures sensitivity (e.g., age demographics, housing materials, reliance on rain-fed agriculture) and adaptive capacity (e.g., access to early warning systems, alternative livelihoods, social safety nets).
- CAPI & Kobo-Toolbox Integration: To generate this index, enumerators deploy digital field surveys. Because platforms like Kobo-Toolbox capture precise geolocations alongside socioeconomic survey data, the resulting dataset can be directly exported as GeoJSON files. This allows demographic vulnerabilities to be spatially rendered and overlaid onto physical hazard maps.
a) Multi-Hazard Economic Risk Quantification
a) Multi-Hazard Economic Risk Quantification: A Transboundary Framework
i) Introduction and Paradigm Shift
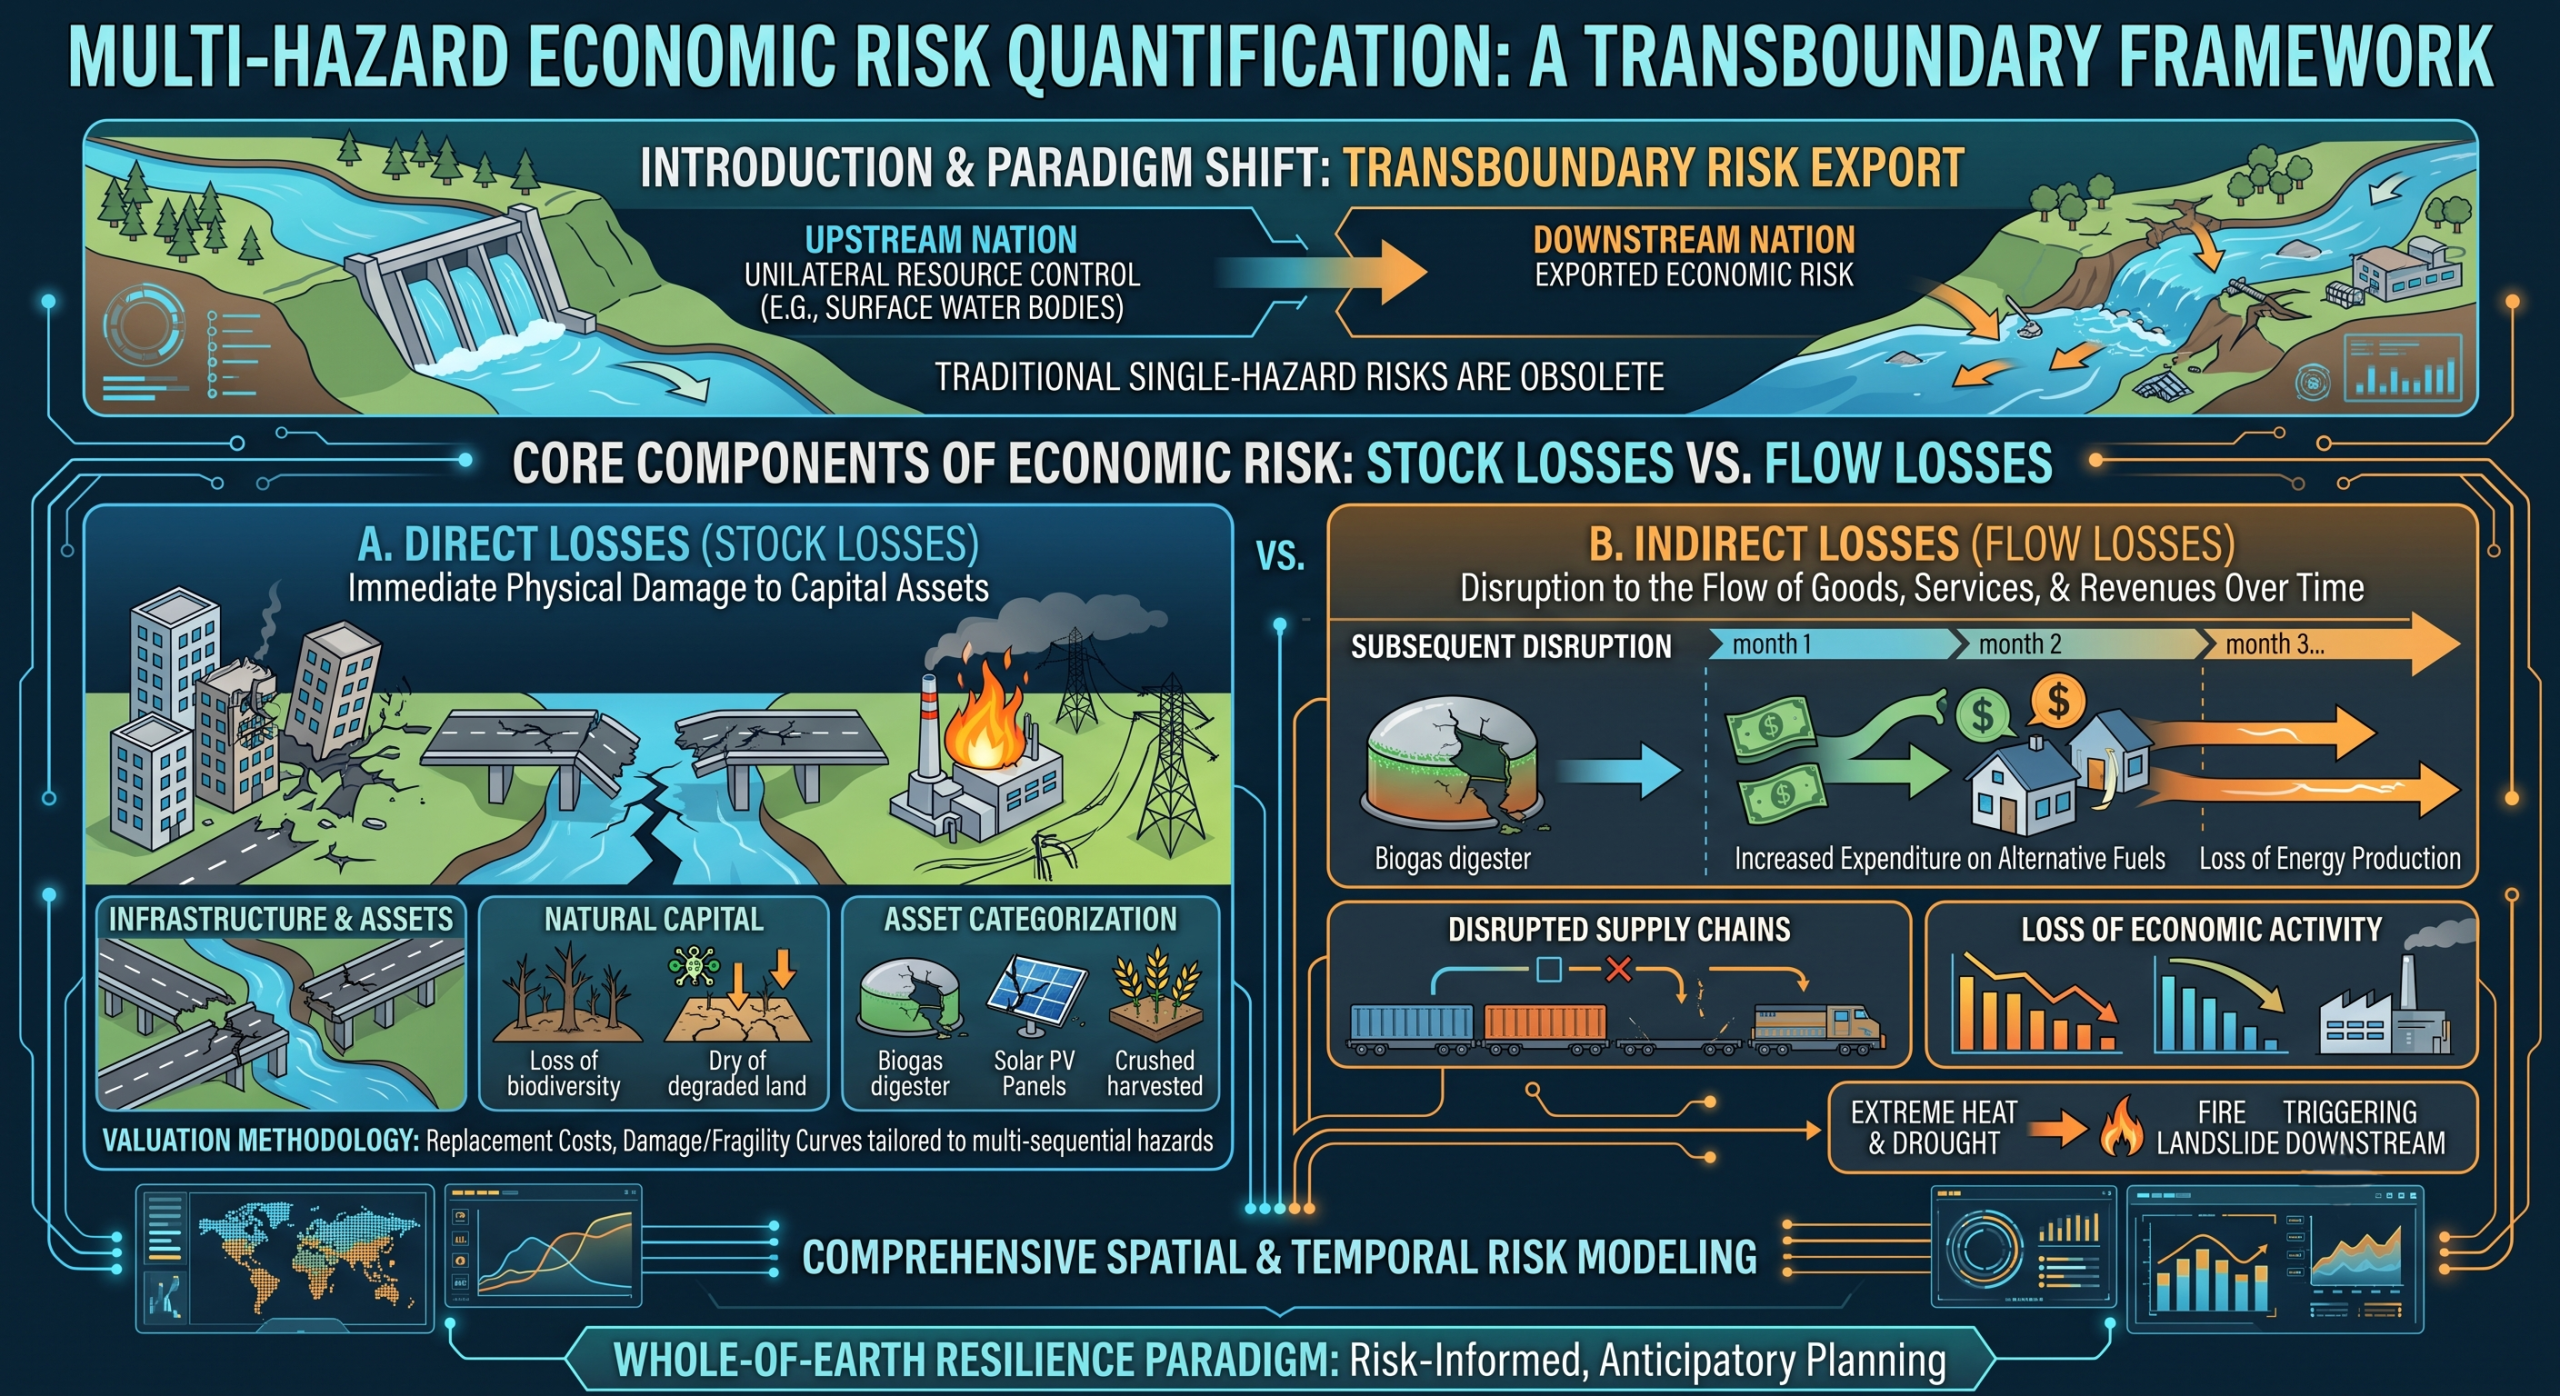
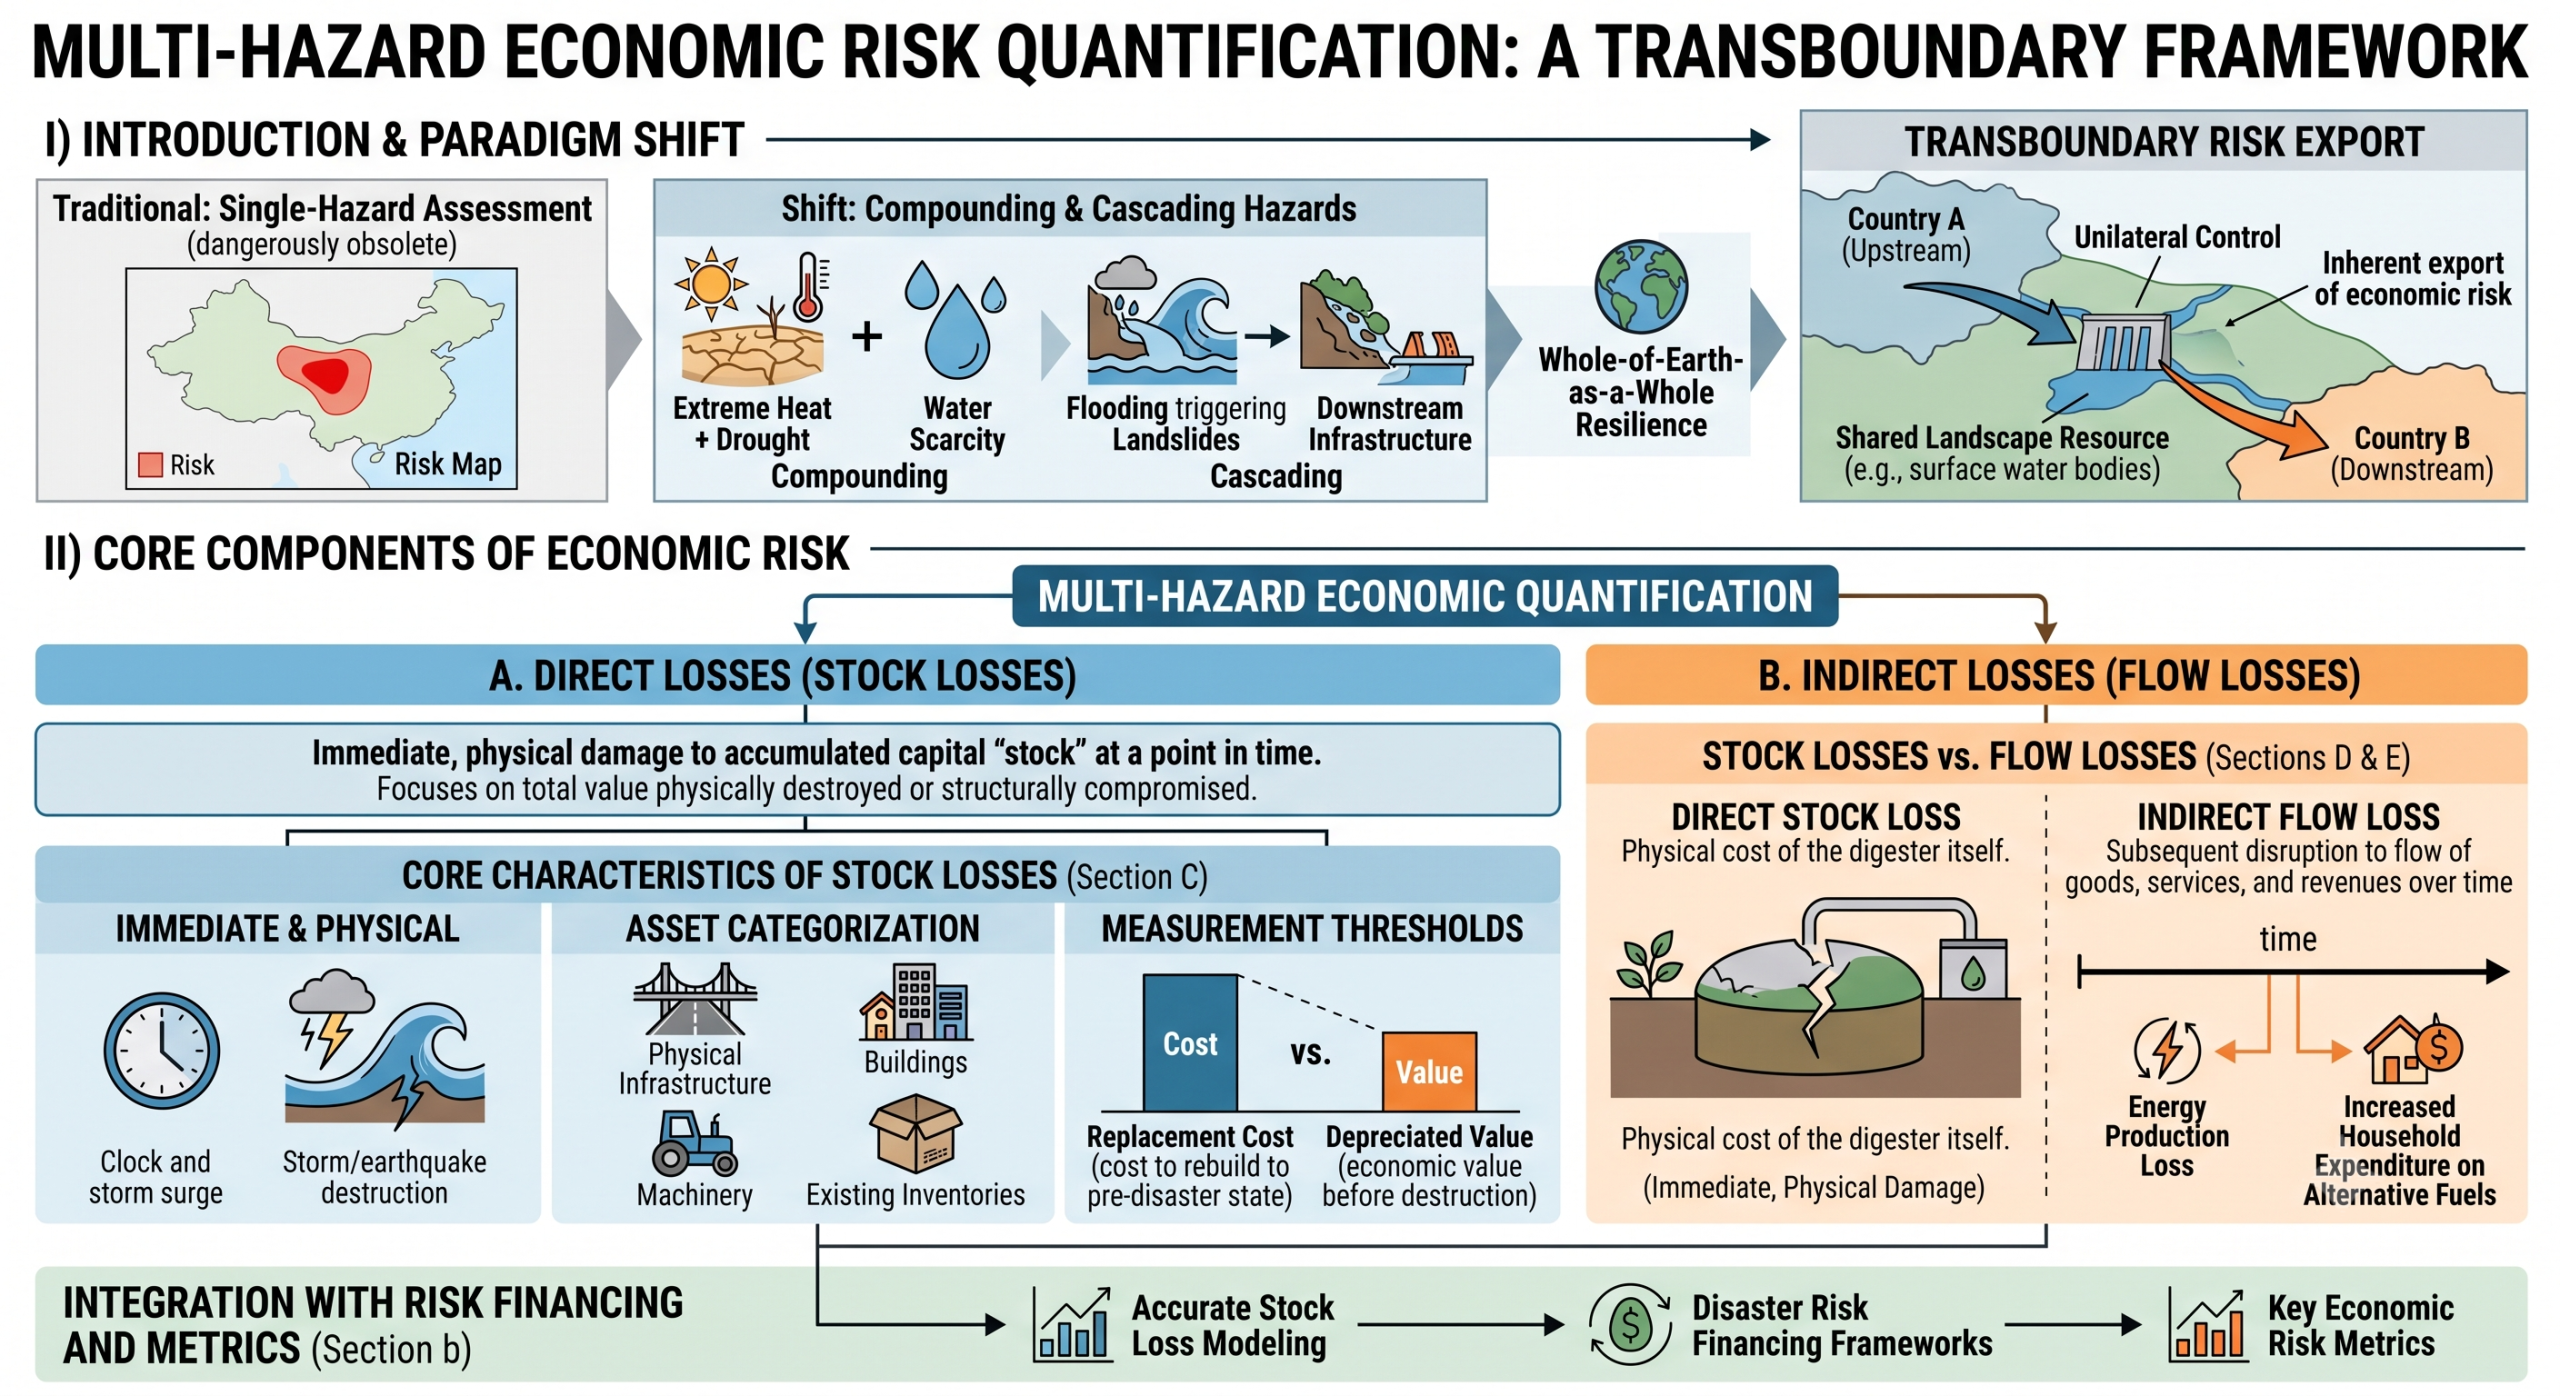
In the context of a rapidly shifting climate regime, traditional single-hazard risk assessments are dangerously obsolete. The current era of climate catastrophes is characterized by compounding (e.g., simultaneous extreme heat and drought) and cascading (e.g., flooding triggering landslides, which destroy critical downstream infrastructure) hazard events.
To achieve the “whole-of-earth-as-a-whole” resilience paradigm, economic risk quantification must transcend political boundaries. When upstream nations exert unilateral control over shared landscape resources such as surface water bodies, they inherently export economic risk to downstream nations. Quantifying this multi-hazard economic risk is essential for holding actors accountable and for formulating transparent, transboundary Disaster Risk Reduction (DRR) policies.
ii) Core Components of Economic Risk
Multi-hazard economic quantification must capture two distinct categories of loss, modeled across spatial and temporal dimensions:\
Direct Losses (Stock Losses)
These are the immediate physical damages resulting directly from the hazard forces.
- Infrastructure & Assets: Destruction of structural resources, housing, and industrial facilities.
- Natural Capital: Loss of biodiversity, degradation of shared ecosystems, and destruction of arable land.
- Valuation Methodology: Replacement cost methods, damage/fragility curves tailored to multiple sequential hazards (e.g., assessing the vulnerability of a building to a flood after it has been weakened by an earthquake or prolonged drought).
- Direct Losses (Stock Losses) in Disaster Economics
In disaster risk management and economic assessment, direct losses, frequently referred to as stock losses, represent the immediate, physical damage to or destruction of capital assets caused by a hazard event.
Because these assets represent accumulated capital “stock” at a specific point in time, measuring direct losses focuses on the total value of what was physically destroyed or structurally compromised at the moment the disaster occurred.
Core Characteristics of Stock Losses
- Immediate and Physical: These losses occur during or immediately after the hazard event (e.g., a cyclone destroying a coastal embankment, flooding ruining agricultural inventory, or an earthquake collapsing a structure).
- Asset Categorization: They encompass physical infrastructure (roads, bridges, power grids like solar PV systems), residential and commercial buildings, machinery, and existing inventories (crops already harvested and stored, livestock).
- Measurement Thresholds: In post-disaster needs assessments (PDNAs), stock losses are typically quantified using either the replacement cost (the cost to rebuild or replace the asset to its pre-disaster state) or the depreciated value (the actual economic value of the asset right before destruction).
Stock Losses vs. Flow Losses
To fully map economic risk, stock losses are always contrasted with flow losses (indirect losses).
While a stock loss is the destruction of the asset itself, a flow loss is the subsequent disruption to the flow of goods, services, and revenues over time. For example, if a biogas digester is destroyed by a flood, the physical cost of the digester is the direct stock loss. The subsequent loss of energy production and the increased household expenditure on alternative fuels over the next six months represent the indirect flow loss.
Stock Losses vs. Flow Losses
To fully map economic risk, stock losses are always contrasted with flow losses (indirect losses).
While a stock loss is the destruction of the asset itself, a flow loss is the subsequent disruption to the flow of goods, services, and revenues over time. For example, if a biogas digester is destroyed by a flood, the physical cost of the digester is the direct stock loss. The subsequent loss of energy production and the increased household expenditure on alternative fuels over the next six months represent the indirect flow loss.
b) Integration with Risk Financing and Metrics
Understanding and accurately modeling direct stock losses is the foundational step for structuring disaster risk financing frameworks and calculating key economic risk metrics
Sendai Framework Alignment
Direct stock loss is the primary driver for reporting on the Sendai Framework, particularly Indicator C-1 (Direct economic loss attributed to disasters in relation to global GDP). Accurately quantifying these physical damages is essential for national reporting and assessing the macroeconomic impact of hazards.
Probable Maximum Loss (PML) and Annual Average Loss (AAL)
Catastrophe risk models rely on historical and simulated direct stock damage to build loss exceedance curves. The vulnerability module of a risk model translates hazard intensity (e.g., flood depth, wind speed) into a mean damage ratio for a given asset stock.
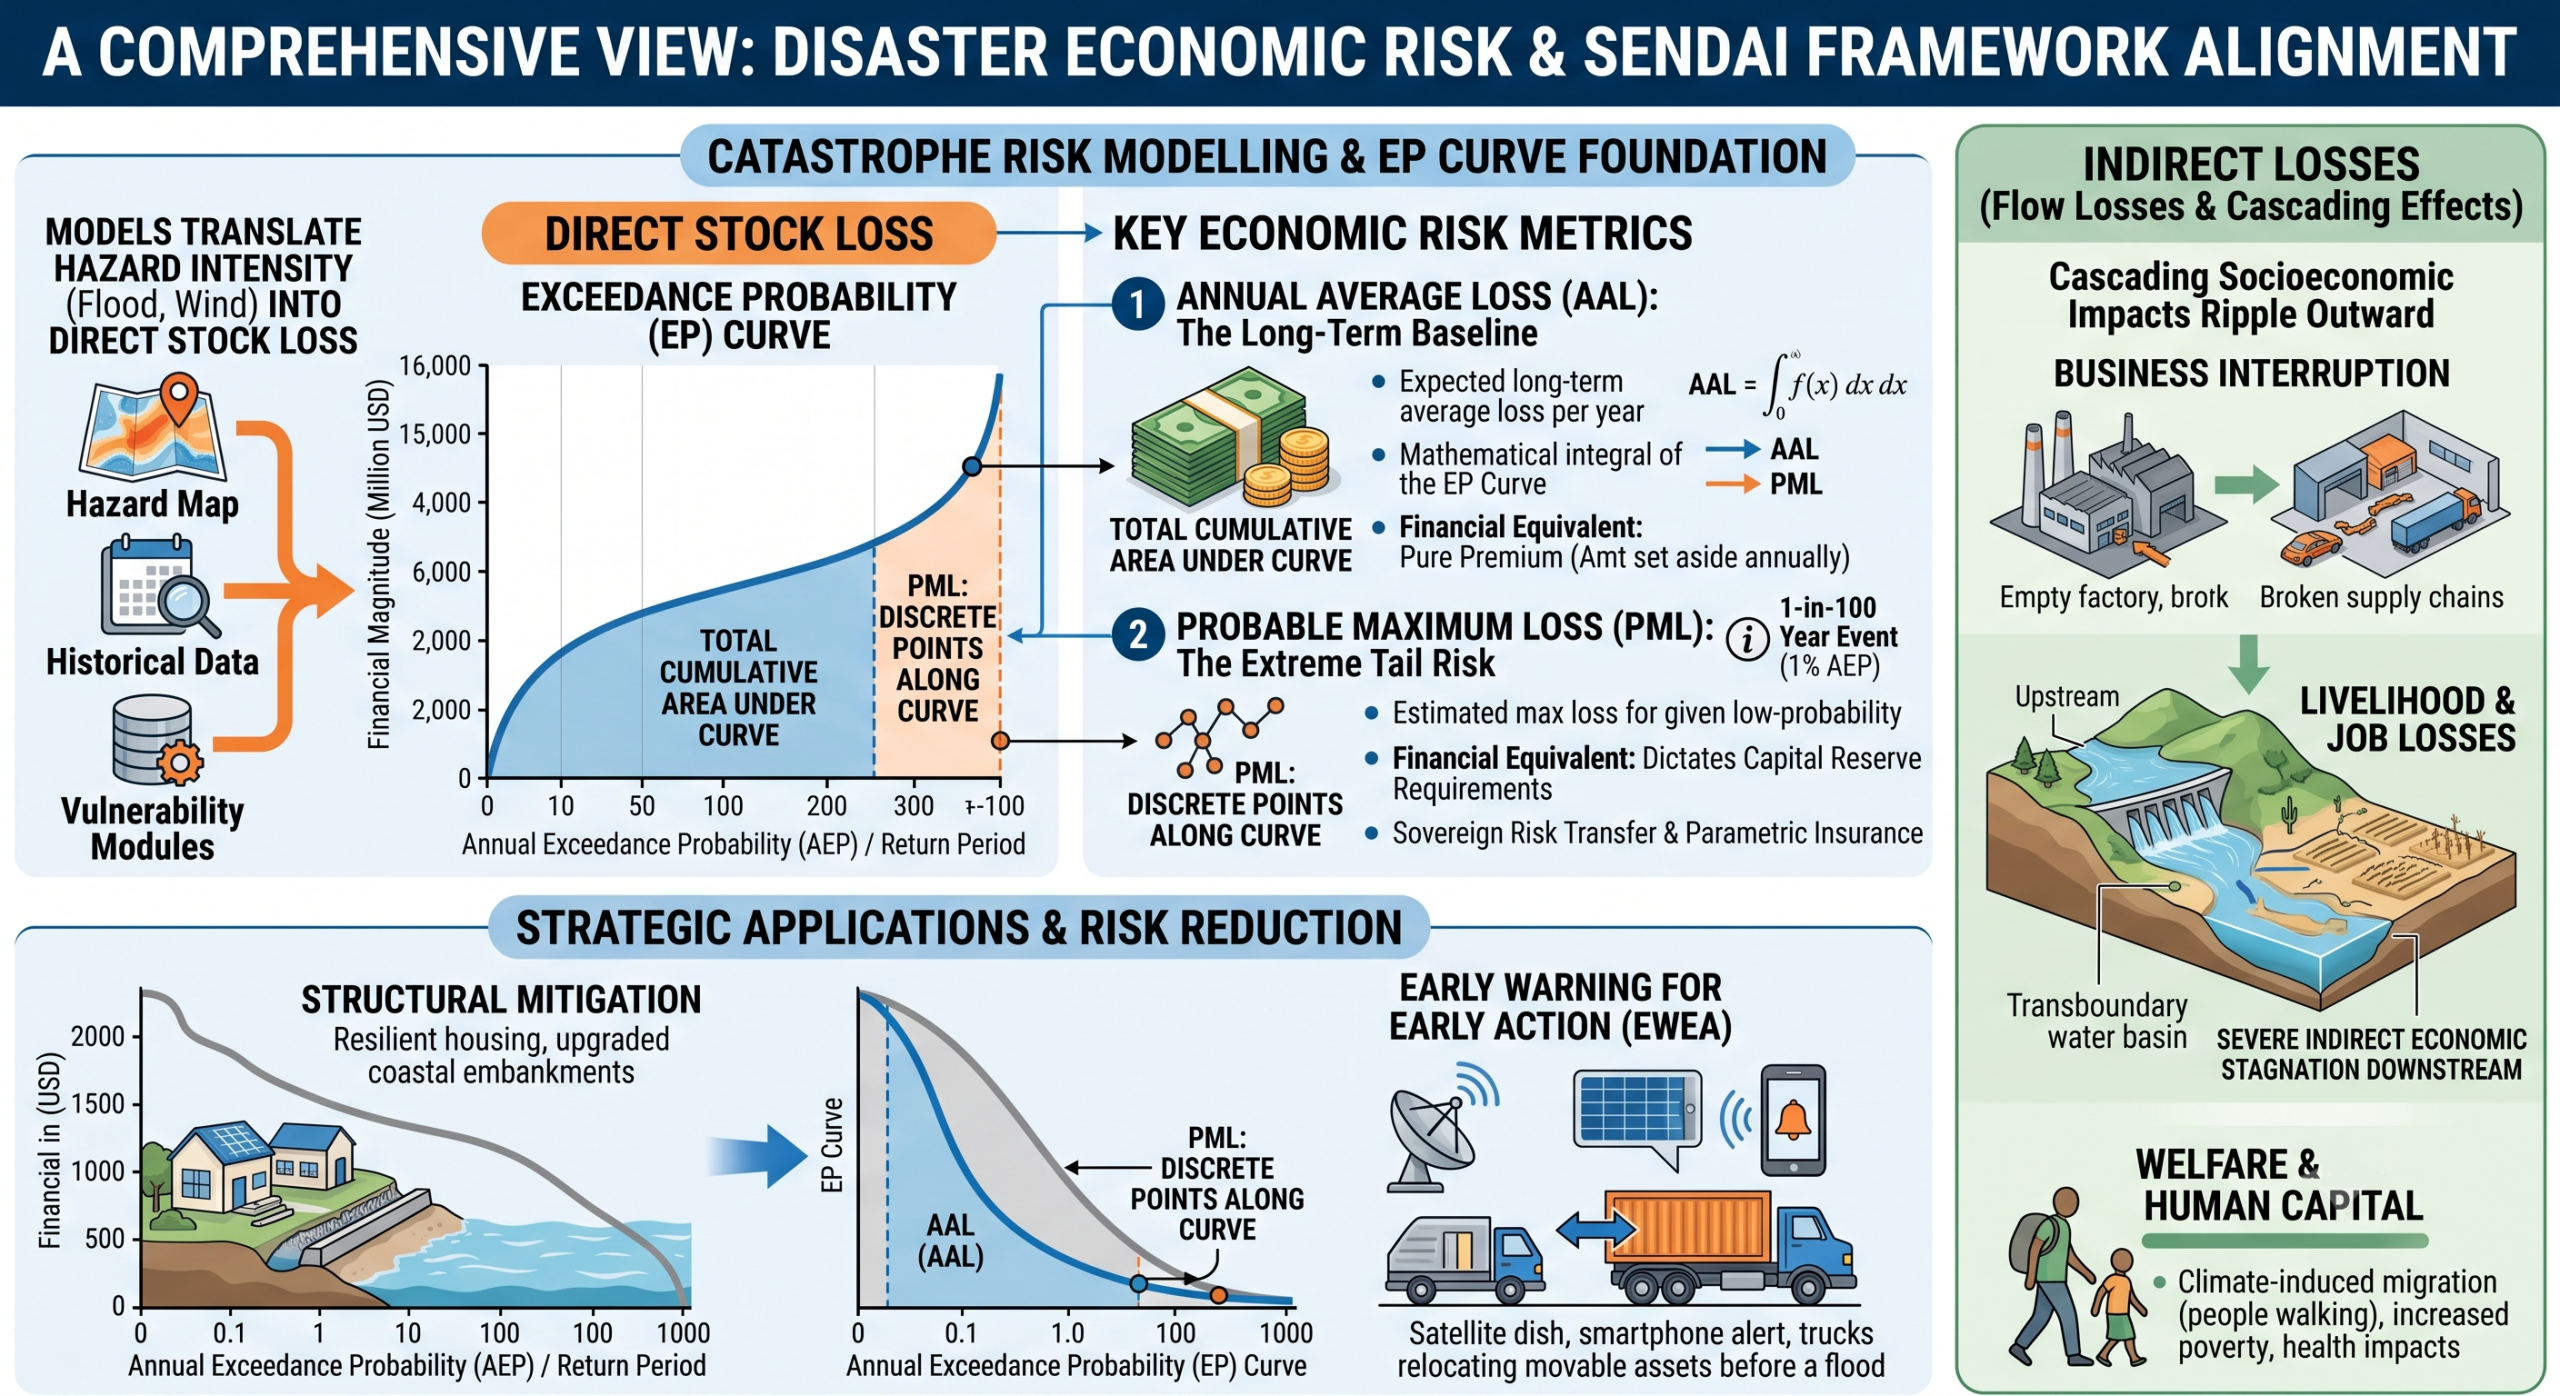
This directly feeds the calculation of the Annual Average Loss (AAL), which represents the expected long-term average of direct stock losses per year, mathematically expressed as the integral of the loss exceedance probability curve:
Where is the direct stock loss at a given exceedance probability . Similarly, the Probable Maximum Loss (PML) provides the maximum expected direct stock loss for specific return periods (e.g., 1-in-100 years), which is critical for structuring sovereign risk transfer mechanisms or parametric insurance.
Field Assessment and Validation
Gathering accurate data on direct stock losses requires establishing precise pre-disaster baselines. This is increasingly managed by overlapping high-resolution geospatial data (GIS mapping, UAV/drone imagery) with rapid post-event field assessments. Digitized data collection tools using structured logic-such as Kobo-Toolbox deployed via Computer-Assisted Personal Interviewing (CAPI)allow for the rapid aggregation and geolocating of household and structural damage data, translating raw physical damage into exportable economic loss metrics.
In disaster risk financing and catastrophe modeling, Annual Average Loss (AAL) and Probable Maximum Loss (PML) are the two foundational metrics used to quantify economic risk. They translate physical hazard data into actionable financial intelligence, enabling governments and organizations to move from reactive disaster response to proactive risk management.
Both metrics are derived from a single mathematical model: the Exceedance Probability (EP) Curve.
Annual Average Loss (AAL): The Long-Term Baseline
The AAL represents the expected long-term average loss per year from a specific hazard (or multiple hazards) over a highly extended timeframe.
- The Concept: If you were to simulate thousands of years of disasters-ranging from frequent, minor floods to rare, catastrophic cyclones-and average out the financial damage per year, that number is the AAL.
- Financial Equivalent: In insurance terms, AAL is the “pure premium.” It is the exact amount of money a government or entity would need to set aside every single year to completely cover all future disaster losses over time.
- Strategic Application: AAL is the standard metric for cost-benefit analyses of resilience investments. For example, if investing in a nature-based solution or upgrading a coastal embankment costs a specific amount, that investment is economically justified if the annualized cost of the infrastructure is less than the resulting reduction in the AAL. Tracking AAL reduction is also a robust method for measuring progress toward Sendai Framework Target C.
Probable Maximum Loss (PML): The Extreme Tail Risk
While AAL looks at the average, the PML looks at the extremes. PML is the estimated maximum loss that is expected to occur for a given, low-probability “return period.”
- The Concept: PML is always tied to an Annual Exceedance Probability (AEP) or a Return Period (RP). For instance, a “1-in-100-year PML” represents the level of financial loss that has a 1% chance of being met or exceeded in any given year.
- Financial Equivalent: PML dictates capital reserve requirements. It answers the question: What is the worst-case financial shock we must be prepared to absorb without facing economic collapse?
- Strategic Application: PML is the primary metric used to structure sovereign risk transfer mechanisms. It determines the “attachment points” (when a policy starts paying out) and “exhaustion points” (the maximum payout limit) for parametric insurance policies and catastrophe bonds.
The Mathematical Relationship: The EP Curve
The Exceedance Probability (EP) Curve plots the probability of a loss occurring (X-axis) against the financial magnitude of that loss (Y-axis).
- PML represents discrete, individual points along this curve (e.g., the loss value at the probability mark on the X-axis).
- AAL represents the total, cumulative area under the entire EP curve.
Mathematically, AAL is expressed as the integral of the loss exceedance probability:
Where is the loss amount at a given exceedance probability .
By shifting the EP curve inward-whether through structural mitigation (like resilient housing) or through Early Warning for Early Action (EWEA) protocols that allow for the relocation of movable assets before impact-both the AAL and the PML are mathematically reduced.
c) Indirect Losses (Flow Losses & Cascading Effects)
This is where the political border-resource control paradigm shows its most devastating effects. Indirect losses are the cascading socioeconomic impacts that ripple outward from the epicenter.
- Business Interruption: Supply chain bottlenecks and halted industrial production.
- Livelihood & Job Losses: The World Bank estimates millions of full-time equivalent job losses annually due to fast-onset shocks. In agricultural basins dependent on shared transboundary water, unilateral withholding of water creates severe indirect economic stagnation downstream.
- Welfare & Human Capital: Increased poverty rates, long-term health impacts, and the economic drain of climate-induced migration.
Advanced Methodologies for Multi-Hazard Modeling
To move beyond tangled bureaucratic inefficiencies, modern risk governance must rely on objective, data-driven quantification methodologies:
Hypergraph and Dynamic Interaction Modeling
Standard GIS overlays fail to capture how one hazard triggers another. Advanced quantification utilizes Hypergraph Theory and Dynamic Modeling to simulate multi-hazard interactions. In this framework, both the hazards (e.g., heavy rainfall, upstream dam release) and the elements at risk (e.g., downstream agriculture, local markets) are modeled as interconnected nodes, allowing policymakers to visualize the cascading economic domino effect before it happens.
Macroeconomic Impact Models
To quantify the “flow losses” across a de-bordered landscape, economists utilize two primary frameworks:
- Input-Output (I-O) Models: Excellent for mapping short-term supply chain disruptions. If a flood destroys a critical bridge in a downstream nation, an I-O model quantifies the exact economic loss to the surrounding regions that relied on that trade route.
- Computable General Equilibrium (CGE) Models: These models are vital for understanding long-term, transboundary economic shifts. They simulate how a multi-hazard shock alters prices, labor markets, and global trade dynamics, forcing a holistic view of the disaster’s true cost.
Open-Source and AI-Driven Risk Engines
Tools like CLIMADA, Risk-Scape, and newly developed AI predictive models allow for the ingestion of vast geospatial datasets. By automating vulnerability assessments, these tools bypass corrupt bureaucratic bottlenecks, offering transparent, verifiable, and highly actionable economic risk metrics directly to last-mile communities.
d) Addressing the Bottlenecks: Governance and Accountability
The mathematical modeling of risk is only as effective as the governance system executing it. The quantification of multi-hazard risks exposes the true cost of unilateral resource control:
- Valuing the “Ex-Ante” Co-Benefits: Traditional bureaucracies often view DRR as a sunk cost. Modern economic quantification proves that investing in shared, transboundary resilience (green infrastructure, joint early warning systems) yields high economic returns even if the disaster never occurs, by boosting market confidence and regional stability.
- Holding Actors Accountable: By precisely quantifying the downstream economic destruction caused by human-induced hazards (e.g., engineered water scarcity), the international community can establish financial accountability mechanisms. The data removes the shield of “natural disaster” from what are often politically engineered catastrophes.
Multi-Hazard Economic Risk Quantification is not merely an academic exercise; it is the financial architecture required for a de-bordered, equitable world. By rigorously calculating the true, cascading costs of climate and human-induced hazards, we transition from reactive, localized aid to proactive, whole-of-society resilience.
e) Adaptation Financing and Integration with Local Government Planning
To secure adaptation financing and integrate with local government planning, the CRVA must translate spatial risk into concrete financial metrics.
Metric | Definition | Purpose in Local Planning |
Annual Average Loss (AAL) | The expected long-term average economic loss per year, averaged over time. | Sets the baseline for annual budget reserves and continuous disaster risk financing frameworks. |
Probable Maximum Loss (PML) | The maximum expected loss for a given return period (e.g., the worst-case 1-in-100-year event). | Determines the threshold for securing parametric insurance, contingent credit lines, or national relief funds. |
Cost-Benefit of Adaptation | Simulating how AAL decreases when an adaptation measure (e.g., raising an embankment or scaling NbS) is applied to the model. | Provides the economic justification for local development budgets and international climate finance proposals. |
Conducting a Cost-Benefit Analysis (CBA) for climate adaptation requires flipping the traditional view of financial returns. Instead of measuring new revenue generated, the “benefit” in adaptation economics is calculated entirely as the avoided loss.
In the context of designing Multi-Hazard Early Warning Systems (MHEWS) or implementing nature-based solutions such as climate-adaptive household models integrated with solar PV and biogas, the baseline metric is the Annual Average Loss (AAL). When an adaptation intervention is introduced, it mathematically reduces the physical vulnerability or exposure of the asset stock, creating a new, lower “Adapted AAL.” The difference between the Baseline AAL and the Adapted AAL represents the annual financial benefit.
e) Core Metrics for Adaptation Financing
For international agencies and local governments structurally aligning with UNDRR frameworks or applying for climate financing, this avoided loss is compared against the capital expenditure (CapEx) and operational expenditure (OpEx) required to build and maintain the adaptation over its lifespan. Three primary metrics are derived:
- Net Present Value (NPV)
NPV calculates the total value of all future avoided losses minus all costs, discounted to today’s value to account for inflation and the time value of money. A positive NPV indicates a financially viable adaptation. The formula is:
- : Avoided loss (benefit) in year
- : Maintenance cost in year
- : Discount rate
- : Upfront capital cost
- : Project lifespan
- Benefit-Cost Ratio (BCR)
The BCR is the total discounted benefits divided by the total discounted costs. A BCR greater than 1.0 means the investment saves more money than it costs. For example, Early Warning for Early Action (EWEA) protocols typically demonstrate exceptionally high BCRs because the capital costs (communication networks, digital data collection via CAPI) are relatively low compared to the massive stock and flow losses they avert.
- Break-Even Point
This represents the specific year in which the cumulative avoided losses finally surpass the upfront and ongoing maintenance costs.
4. The Core Spatial Engine: Comprehensive CRVA & Multi-Hazard Risk Assessment
To design a system that captures both sudden-onset hazards and slow-onset climate changes, the GIS framework must blend exposure, hazard, and vulnerability layers.
- Hazard Modelling & Exposure Mapping: Integrating macro-level Earth Observation data (e.g., historical rainfall trends, sea-surface temperature anomalies, NDVI) with micro-level UAV (drone) photogrammetry to map high-risk zones, such as floodplains, landslide-prone slopes, or coastal erosion lines.
- Vulnerability Indexing: Developing a dynamic, composite vulnerability index that overlays environmental risk layers with socioeconomic data. This includes mapping household-level adaptive capacitiessuch as reliance on climate-sensitive livelihoods versus access to diversified assets.
- Economic Risk Metrics: Designing algorithms within the GIS engine to calculate Annual Average Loss (AAL) and Probable Maximum Loss (PML), giving local governments the concrete financial risk metrics required for risk-informed decision-making.
f) Primary Data Collection & PDNA Architecture
Post-Disaster Damage, Loss, and Needs Assessments (PDNA) require speed, accuracy, and standardization to unlock recovery financing (such as Sendai Framework Indicator C-1 reporting).
- Mobile Data Collection (MDC): Standardizing field assessment forms via Computer-Assisted Personal Interviewing (CAPI) frameworks on platforms like KoboToolbox or ODK. These forms capture:
- Structural and agricultural damage categorization.
- Geolocation points and boundary polygons.
- Embedded, timestamped photographic evidence.
2. Interoperable Data Pipelines: Configuring the system to automatically pipe field data out as structured CSV and GeoJSON files. This allows the incoming damage reports to instantly populate central GIS dashboards, mapping the spatial distribution of loss in real time.
3. Early Warning for Early Action (EWEA) & Preparedness Planning
A true Multi-Hazard Early Warning System (MHEWS) must bridge the gap between technical monitoring and localized response.
- Telemetry & IoT Integration: Designing API gateways that ingest continuous, real-time data streams from Automated Weather Stations (AWS) and hydrological sensors.
- Threshold Trigger Logic: Building automated alert logic based on predefined physical thresholds (e.g., water level exceeding a critical mark, or cumulative rainfall over 48 hours). When triggered, the system auto-generates localized early action protocols.
- The “Last Mile” Communication: Developing ICT tools that translate technical warnings into actionable, community-level alerts. This includes targeted SMS, automated voice messaging, and digital radio triggers tailored to local languages and contexts.
- Nature-Based Solutions (NbS) & Locally Led Adaptation (LLA) Mapping
To scale nature-based and locally led initiatives, the ICT toolkit must treat community assets as quantifiable adaptation metrics.
- Green Infrastructure Inventories: Utilizing remote sensing and participatory GIS mapping to catalog existing ecosystemssuch as mangrove buffers, wetland retention basins, or community forestsevaluating their protective capacity against specific hazard return periods.
- Household-Level Resilience Modeling: Tracking the adoption and efficiency of localized, integrated climate adaptive models (e.g., household biogas digesters, solar PV installations, rainwater harvesting networks). The GIS system maps these as decentralized nodes of climate resilience, evaluating how localized food and energy security impacts broader community vulnerability.
- Mainstreaming into Local Government Planning and Budgeting
The technical tools are only as effective as their integration into local institutional frameworks.
- Risk-Informed Budgeting Tools: Creating simplified, dashboard-driven decision-support software for local government officials. These tools cross-reference spatial CRVA maps with local development proposals, flagging whether a planned infrastructure project sits in a high-risk zone or violates climate-adaptive zoning.
- Participatory Planning Integration: Bridging qualitative, community-led data (from Focus Group Discussions, Transect Walks, and Participatory Risk Mapping) with quantitative spatial layers. This ensures that localized climate action plans are grounded in verified local needs while remaining technically sound for national or international financing approval
[ The copyright © 2026 Z M Sajjadul Islam, Advisor, Multi-Hazard Early Warning System Design and Implementation Center (MHEWC – www.mhewc.org www.glocs.org ). All rights reserved. Any material quoted, reproduced, adapted, or extracted from this technical strategy document must be properly cited and attributed to the author to avoid legal issues. Please call at +8801711979179, Email: zmsajjad@gmail.com ]
———————————-End—————————————————
Climate Risk & Vulnerability Assessment……
Climate Risk & Vulnerability Assessment
MHEWC provides technical support at the country level to design, and develop the complete set of GIS and ICT tools based on comprehensive climate risk and vulnerability assessment( CRVA), Multi-hazard risk assessment, Post-disaster damage, loss and needs assessment (PDNA), multi-hazard preparedness, response and recovery planning, sector level and integrated climate change adaptation (CCA) local government planning and budgeting system, CCA, Disaster Risk Reduction (DRR), Nature-based Solution(NbS), Locally led adaptation (LLA) etc.
Undertake cross-border analysis of the gendered impacts of climate-induced hazards in Malawi, Mozambique, Malawi
……………………………………………………………………………………………………………………………………………………………………………………..
Questionnaires on Preparedness Phase ( Mozambique, Malawi, Zimbabwe )
Questionnaire for the Preparedness Phase of Cyclone, Floods and Drought
1) Type of Methodology, tools and guidelines does the duty bearer utilize in developing preparedness plans for cyclone, flood and drought ?
1. Refined technical background text (you can copy–paste)
Multi-hazard and climate risk and vulnerability assessment (CRVA) and the development of risk-informed tools at national and sub-national levels form the foundation for precision-level multi-hazard early warning, impact-based forecasting, weather warning, alerting and outlook services. These products depend on a robust geospatial CRVA repository built from GIS maps that capture:
- Landscape and topographical patterns
- Environmental settings and ecological elements
- Vegetation and land use/land cover
- Soil composition
- Geological and geomorphological characteristics
- Hydrometeorological and weather patterns
- Existing physical installations and infrastructure
- Climatic and multi-hazard exposure, and
- The risk and vulnerability of exposed elements on the ground.
By overlaying weather and climate forecasts, warning outlooks, and hazard scenarios (e.g. cyclone, heavy rainfall, drought) on this geospatial CRVA repository—linked to precisely geolocated elements—it becomes possible to:
- Estimate the intensity and spatial extent of hazards
- Assess the impact level on exposed elements
- Calculate anticipatory loss and damage (L&D) to people, assets, livelihoods and critical services before an event occurs.
Within this framework, the WRD gender impact assessment seeks to review the most important CRVA reports, methodologies, processes and operational tools used at national, provincial, district, sub-district and village levels. This includes:
- GIS and remote sensing maps
- GPS-based applications for capturing coordinates of elements,
- Photographic documentation of elements and their highest recorded flood levels, and
- GIS base maps depicting local geographic features and infrastructure.
Of particular importance is the geospatial identification of women’s exposure and vulnerability, including:
- Coordinates and locations of women-headed households (based on sex, age and disability disaggregated data – SADDD)
- Women-headed farmlands and smallholder plots
- Fisheries farms/ponds
- Women-led business points and value-chain service trigger points
- Flood-proof and climate-resilient sectoral lifeline services such as WASH facilities, health centers, water supply systems, food security assets, agency-managed disaster shelters, core family shelters, public buildings, schools, boreholes and water points.
Accurate mapping of these elements over district- and village-level GIS maps enables precision emergency preparedness planning, including the pre-positioning of humanitarian assistance and services. This is critical for saving lives in situations where physical communication channels are disrupted, landscapes become isolated, and communities in hard-to-reach areas face heightened risk.
2. What the WRD gender impact assessment will review (bullet outline) ?
You can use this as a checklist or sub-headings:
- CRVA documentation
- National and sub-national CRVA reports (cyclone, flood, drought)
- Methodological guidelines and technical notes
- Risk classification and hotspot maps
- CRVA methodologies and processes
- Hazard, exposure, vulnerability and risk analysis methods
- Integration of climate change projections
- Use of impact-based forecasting and early warning
- Inclusion of gender, disability and social vulnerability dimensions
- CRVA tools and datasets
- GIS base maps (topography, land cover, infrastructure, administrative units)
- Remote sensing products (flood extent, drought indices, vegetation)
- GPS/mobile data collection tools for elements at risk (households, farms, services)
- Photo documentation and records of highest flood levels
- Spatial databases / CRVA repositories at national and sub-national levels
- Gender, SADDD and women’s livelihoods
- SADDD databases and linkage with CRVA layers
- Geolocated data on:
- Women-headed households
- Women-headed farmlands and fisheries ponds
- Smallholder farmlands
- Women-led businesses and value chain nodes
- Evidence on differentiated impacts and capacities of women, men, youth, and persons with disabilities
- Lifeline and critical basic services
- Mapping of flood-/hazard-proof:
- WASH facilities
- Health centers and clinics
- Schools and education facilities
- Disaster shelters and core family shelters
- Boreholes, water points, and food security infrastructure
- Their accessibility to women and vulnerable groups during emergencies
- Mapping of flood-/hazard-proof:
- Use of CRVA in preparedness and anticipatory action
- How CRVA and impact-based forecasts inform:
- Emergency preparedness plans
- Pre-positioning of humanitarian assistance
- Anticipatory actions (e.g., early cash, livelihood protection, relocation of assets)
- Specific measures targeting women-headed households and hard-to-reach areas.
- How CRVA and impact-based forecasts inform:
1. Availability of CRVA and PDNA reports by administrative level
1.1 CRVA coverage
- Are CRVA reports available for the following administrative levels?
- ☐ National
- ☐ Province / Region
- ☐ District
- ☐ Municipality / City Corporation
- ☐ District town / Municipal town
- ☐ Sub-district / Upazila / Ward (adapt to context)
- ☐ Village / Community level
For each level, please specify:
- Year(s) of CRVA:
- Main hazards covered (cyclone, flood, drought, etc.):
- Lead institution and partners:
- Whether gender/SADDD is integrated: ☐ Yes ☐ Partially ☐ No
1.2 PDNA coverage (Post-Disaster Needs Assessment)
- Have PDNA or similar post-disaster assessment reports been conducted for major events (cyclone, flood, drought) in this area?
- ☐ Yes ☐ No
If yes, please specify:
- Year and type of disaster:
- Administrative levels covered (province, district, municipality, village, etc.):
- Whether PDNA findings feed into emergency preparedness planning: ☐ Yes ☐ Partially ☐ No
- Whether PDNA includes gender-disaggregated and women’s livelihood analysis: ☐ Yes ☐ Partially ☐ No
2. Stakeholders involved in CRVA / PDNA and risk assessment
2.1 Types of institutions and stakeholders engaged
- Which stakeholders are engaged in CRVA / PDNA / risk assessment processes?
Tick all that apply and add names: - ☐ National disaster management authority / ministry:
- ☐ Hydrometeorological / meteorological and hydrology departments:
- ☐ Line ministries (agriculture, fisheries, livestock, WASH, health, education, etc.):
- ☐ Provincial / regional government departments:
- ☐ District administration and technical departments:
- ☐ Municipal / town authorities and technical units:
- ☐ Local government bodies (union councils, village councils, ward committees):
- ☐ Women’s affairs / gender ministry or department:
- ☐ Social protection and statistics/census departments:
- ☐ NGOs / CSOs (including women’s rights organizations):
- ☐ Community-based organizations (CBOs):
- ☐ Private sector (e.g., telecom, agri-business, financial services):
- ☐ Academic and research institutions / universities:
- ☐ Representatives of vulnerable groups (women-headed households, persons with disabilities, elderly, youth, minorities, etc.):
3. ICT tools and data sources for CRVA and risk mapping
3.1 Geospatial and remote sensing tools
Which ICT tools and spatial datasets are used in CRVA and risk mapping?
- ☐ GIS desktop software (e.g. QGIS, ArcGIS):
- ☐ Government-produced GIS base maps (administrative boundaries, roads, rivers, land use):
- ☐ Local government GIS maps:
- ☐ Remote sensing / satellite images (e.g. Sentinel, Landsat, commercial imagery):
- ☐ Google Earth / Google satellite imagery:
- ☐ Drone imagery for detailed local mapping:
- ☐ Online geospatial platforms / webGIS for elements at risk (please specify):
- ☐ Government statistics and census datasets for population and socio-economic data:
For each major tool/source, describe:
- Purpose (hazard mapping, exposure mapping, damage assessment, etc.)
- Scale (national, province, district, village)
- How often it is updated.
3.2 GPS / mobile tools for field data collection
- Are GPS-enabled tools or mobile applications used to capture coordinates of elements at risk?
- ☐ Yes ☐ No
If yes, what tools/apps? (e.g. ODK/Kobo, ArcGIS Field Maps, QField, other):
- What types of elements are captured?
- ☐ Households (including women-headed households)
- ☐ Farmlands / smallholder plots
- ☐ Fisheries ponds/farms
- ☐ Business points / markets / value chain nodes
- ☐ WASH facilities, health centers, schools
- ☐ Disaster shelters, core family shelters, key buildings
- ☐ Water boreholes and water points
- ☐ Highest historical flood levels at specific locations
- ☐ Other (specify):
4. Household-level SADDD and gender data
4.1 Data sources and methods
- Are Sex, Age and Disability Disaggregated Data (SADDD) available at household level for the area?
- ☐ Yes ☐ Partially ☐ No
If yes:
- Main data sources:
- ☐ National census
- ☐ Household surveys (e.g. LSMS, DHS, MICS, etc.)
- ☐ Social protection / beneficiary registries
- ☐ CRVA-specific surveys
- ☐ NGO/UN programme surveys
- ☐ Other (specify):
4.2 Data collection tools
- What tools are used to collect household-level SADDD?
- ☐ Paper-based questionnaires
- ☐ Mobile data collection (Kobo, ODK, SurveyCTO, CommCare, etc.)
- ☐ Tablets / smartphones with GPS
- ☐ Online data entry platforms
- Are GPS coordinates of households (including women-headed households) captured?
- ☐ Yes, systematically
- ☐ Yes, partially
- ☐ No
- Are SADDD and GPS data integrated into GIS / CRVA maps?
- ☐ Yes ☐ Partially ☐ No
5. Multi-hazard Risk Atlas and update process
5.1 Existence and scope of risk atlas
- Is there a Multi-Hazard Risk Atlas (printed or digital) for:
- ☐ National level
- ☐ Province / region
- ☐ District
- ☐ Municipality / town
- ☐ Sub-district / union / ward
- ☐ Village / community
- Hazards included:
- ☐ Cyclone / windstorm
- ☐ Riverine flood
- ☐ Flash flood
- ☐ Storm surge
- ☐ Drought
- ☐ Landslide / erosion
- ☐ Other (specify)
5.2 Consultation process for developing the atlas
- Was the atlas developed with multi-stakeholder consultation?
- ☐ Yes ☐ Partially ☐ No
If yes, which processes were used (tick all):
- ☐ Community PRA (Participatory Rural Appraisal) exercises
- ☐ Focus Group Discussions (FGDs) with community groups (including women, youth, persons with disabilities)
- ☐ Key Informant Interviews (KIIs) with local leaders and sector experts
- ☐ Workshops with local government, sector agencies and CSOs
- ☐ Validation sessions using GIS maps with communities
- Are risks and local knowledge captured directly on GIS maps during PRA/FGD/KII (e.g. sketch maps digitized into GIS; field marking of hotspots)?
- ☐ Yes ☐ Partially ☐ No
5.3 Use of technology in risk mapping
- Are online GIS/GPS apps, drone imagery and satellite images used to support:
- Local risk mapping and exposure analysis: ☐ Yes ☐ No
- Validation of community-identified hotspots: ☐ Yes ☐ No
- Damage and Loss assessments after events: ☐ Yes ☐ No
5.4 Regular updates
- Are multi-hazard risk, exposure and vulnerability layers regularly updated?
- ☐ Yes, with a defined schedule (e.g. annually, after major events)
- ☐ Yes, but ad hoc
- ☐ No / rarely
- Are sectoral and livelihood elements (agriculture, fisheries, WASH, health, education, markets, etc.) updated in the risk atlas?
- ☐ Yes ☐ Partially ☐ No
- Is there an impact repository (database of historical impacts, Loss & Damage) linked to the atlas?
- ☐ Yes ☐ No
6. Women’s livelihoods and gender in CRVA and risk atlas
6.1 Mapping women’s livelihood elements
- Are women’s livelihood elements clearly plotted on maps?
For example:- ☐ Women-headed farmlands and smallholder plots
- ☐ Women-managed fisheries ponds/farms
- ☐ Women-led business points / shops / market stalls
- ☐ Women’s value-chain service points (input supply, processing, transport, retail, etc.)
- Is the risk and vulnerability of these women’s livelihood elements described and analyzed in CRVA reports or atlases?
- ☐ Yes, explicitly
- ☐ Yes, partially
- ☐ No
6.2 Women Livelihood Risk Atlas
- Has a Women’s Livelihood Risk Atlas or similar product been developed?
- ☐ Yes (national)
- ☐ Yes (sub-national)
- ☐ In progress
- ☐ No
If yes, briefly describe:
- Scope (hazards, sectors, geographic coverage)
- How it is used for emergency preparedness and anticipatory action.
6.3 Participatory consultation with vulnerable groups
- Were vulnerable groups actively involved in risk assessment and validation?
- ☐ Women-headed households
- ☐ Pregnant and lactating women
- ☐ Persons with disabilities
- ☐ Elderly persons
- ☐ Landless or extremely poor households
- ☐ Ethnic/linguistic minorities
- ☐ Youth and adolescent girls
- What methods were used?
- ☐ Community PRA
- ☐ FGDs (targeted women-only groups, disability groups, etc.)
- ☐ KIIs with representatives of vulnerable groups
- ☐ Household interviews / surveys
- ☐ Participatory mapping using GIS or printed maps
- Were social, economic, financial and other vulnerabilities (e.g. access to credit, land tenure, social norms, GBV risk) documented?
- ☐ Yes, systematically
- ☐ Yes, partially
- ☐ No
7. Use of community-based PRA, FGD, KII in risk mapping
7.1 Integration with GIS
- Are the outcomes of Community PRA, FGDs and KIIs:
- ☐ Translated into GIS layers (e.g. digitized community risk maps)
- ☐ Used only in narrative form, without mapping
- ☐ Not systematically used
- Are community-identified risks and hotspots visually validated with GIS or printed maps during feedback sessions?
- ☐ Yes ☐ Partially ☐ No
Availability of Geospatial platform based multi-hazard risk atlas and CRVA administrative areas (Province, District, Municipality, District Town, Municipal town, Village) for facilitating the emergency preparedness planning
- Availability of geospatial platform and dataset accessible to local stakeholders for developing local level Preparedness plans
- Logn rage weather forecast /outlook being utilized for informing the early preparedness planning and sectoral alerting ?
- Engaged institution linked with Regional Early warning system in preparedness planning
- How stakeholder develop humanitarian program cyclone ? Consideration of the following factors for preparation of preparedness plan
- CRVA informed tools based prepositioning emergency humanitarian assistance at local level
- Gendered classified People in Need (PIN)
- Contingencies being prepared with CRVA Classified gender needs (Sex, age, and disability disaggregated) datasets, location, , risk driver factor consideration.
- Informed tools driven contingency plans minimizes the planning gaps, resource gaps and effectively utilized as guided tools for emergency evacuation, emergency mobilization and saving life and livelihood assets.
- What type of gap identified on gender sensitive preparedness and contingency planning ?
- Availability of geospatial platform and dataset accessible to local stakeholders for developing local level Preparedness plans
- Logn rage weather forecast /outlook being utilized for informing the early preparedness planning and sectoral alerting ?
- Engaged institution linked with Regional Early warning system in preparedness planning
- Roadmap of preparing early warning :
- Review Steps , procedures of preparing early warning system ( Cyclone)
| Cyclonic Development Stage | Responsibility of national Storm warning center, Met agency, Nowcasting, flood forecasting and early warning system (FFWC), NMHS in extreme weather events and impeding disaster conditions | Preparedness Advisory to NDMO, EOCs, Sector departments, Local gender machineries, front line community, gender working group, frontline women headed households at high risk areas ( CRVA risk repository and raking) | Indicative gaps over the tools, process, early warning development, operational forecasting, warning, alerting, impact forecasting for sectors and women headed households over the vulnerable areas |
| Tropical disturbance, tropical depression level ( </= 62 kmh) | La-reunion tropical storm warning center and Met agency able to predict the depression level? | Storm related advisories go for alerting frontline that there are likelihood of impending storm over the sea. Responsibility of gender machinery, Women group, women leadership, Women and social ministry, relevant women led organization. Any operational forecast being issued by those stakeholders to getting women headed household well award, prepared for and respond to. | What is level of performance of warnings being issued by the La Reunion , National Met Agency? |
| Moderate Cyclonic storm ( 63-88kmh) | La-reunion tropical storm warning center and Met agency able to predict the Cyclonic storm level? and advisory on tracking path and impact level early? | What advisory goes NDMO and above group about lead-time for the preparedness of saving properties ?Any impact forecast, operational forecasts considering the tacking path, epicenter of landfalls, decapitation path over the ground and areas of tracking could potentially be devastated , so that vulnerable women well alerted and follow the operational forecasts for taking personal/household level measures of saving life and properties ? | 1)What is level of performance of warnings being issued by the La Reunion , National Met Agency? 2)What are the indicative gap on appropriate advisories and operational forecasts for women headed households? |
| Severe cyclonic storm ( 89-117kmh) | La-reunion tropical storm warning center and Met agency able to clearly predict the Cyclonic storm level? and advisory on tracking path, epicenter of taking landfalls, impact level based on developing stage , energy level, velocity and impeding conditions in early ?( case studies of past cyclone …………………… Precision level weather warning, alerting, impact forecasts, operational forecasts on cyclone induced storm surge , precipitation intensity over the ground, probable coastal and inland flooding area, Lead-time to take landfall and epicenter of landfall etc. ?( case studies of past cyclone ……………………) | At this stage what advisory goes NDMO and above group about lead-time for the preparedness of saving properties and lives?Sufficient informed tools e.g. classified advisories, sectoral operational forecasts, sectoral impact forecasts for preparedness planning | Indicative gap on appropriate advisories at this stage and necessary operational forecasts for women headed households. |
| Tropical Cyclone ( 118-165 kmh) | At this stage what advisory goes NDMO and above group about lead-time for the preparedness of saving properties and lives?Sufficient informed tools e.g. classified advisories, sectoral operational forecasts, sectoral impact forecasts for preparedness planning | Indicative gap on appropriate advisories at this stage and necessary operational forecasts for women headed households. | |
| Intense Tropical Cyclone (166- 212 kmh) | At this stage what advisory goes NDMO and above group about lead-time for the preparedness of saving properties and lives ?Sufficient informed tools e.g. classified advisories, sectoral operational forecasts, sectoral impact forecasts for preparedness planning. | Indicative gap on appropriate advisories at this stage and necessary operational forecasts for women headed households. | |
| Very Intense Tropical Cyclone (213 kmh and above ) | What advisory goes NDMO and above group about lead-time for the preparedness of saving properties and lives ?Sufficient informed tools e.g. classified advisories, sectoral operational forecasts, sectoral impact forecasts for preparedness planning . | Indicative gap on appropriate advisories at this stage and necessary operational forecasts for women headed households. |
- Review Steps, procedures of preparing Flood early warning system :
| Flood forecasting and early warning system | Responsibility of national FFWC in tools preparation, operational forecasting process, early warning development forecasting, warning, alerting, impact forecasting on the impeding floodings | Preparedness Advisory to NDMO, EOCs, Sector departments, Local gender machineries, front line community, gender working group, frontline women headed households at high risk areas ( CRVA risk repository and raking) | Indicative gaps over the tools, process, early warning development, operational forecasting, warning, alerting, impact forecasting for sectors and women headed households over the vulnerable areas |
| Observation System in place | Any form of hybrid weather[1] observation system currently functional over the high value elements for tacking impeding rapidly developing thunderstorm for the high value elements ( rural settlements , vulnerable structures of households, urban settlements, basic utility structures, lifeline services structures, sectoral elements ) , women headed location of entrepreneurs , value chain location, business unit ? | Having Access to compendium of regional multi-hazard early warning system e.g. SADC WMO center at Pretoria? | What are the observation tools gap ? What are the stakeholder partnership gap in accessing early warning ? |
| Any data acquisition from transbay upstream river network ? a) Mozambique from Malawi and Zimbabwe , Zimbabwe from Zambia etc. | Transboundary data incorporate in FFWC central server for issuing effective early warning at downstream countries | EOC develop any operational forecast and Impact based forecast for the vulnerable sector | |
| Telemetric observation over the river system | Central FFWC having data acquisition from telemetric river gauging station? Processing flood level data and predict Flood forecasting and early waring over the geospatial portal? | EOC develop any operational forecast and Impact based forecast for the vulnerable sector? | What are the indicative gaps on precision level flood forecasting ? |
| Having any Telemetric / Automatic weather observation for tracking convective clouds and tracking sudden onset heavy precipitation ? | Level of FFWC capacity on Realtime issuing flash flooding, landslide, mudslide for saving lives | EOC develop any operational forecast and Impact based forecast for the vulnerable sector? | What are the indicative gaps on precision level flash flood forecasting ? |
| Capacity of nowcasting | Constant event situation tracking ( if heavy rainfall starts at midnight and need evacuation in 15-30 minutes to an hour ? What are the relevant very rapid-onset public alerting, warning( RDT- warning, Nowcasting, heaving rainfall alerting ) so that vulnerable people be alerted 30-munties to 1-6 hours ago that heavy rainfall are highly-likely over those aeras are please take emergency shelter. | 1)What about EOC’s responsibility on nowcasting of rapidly developing weather conditions ? 2)Tools and process of event situation reporting? | What are the indicative gaps on precision level nowcasting, event s |
What are the level of drought early warning system complying the Sendai Framework Approach on Warly warning for All ?:
- Mechanism of developing Impact based Early warning, tracking the disaster path( hotspot) based on the landscape fragility , topography, soil condition, environmental settings ( susceptibility of landslide, mudslide, rockfall, debris fall, collapsing built-in physical infrastructure ) , epicenter, severe, very-high, high, medium impact areas ?
- Availability of national, province, district level drought early warning system and linkage with global and regional drought early warning system?
- Having access to IDEA FAO tracking the SMEs for preparing outlook of food security?
- Any online value chain information management system for supporting food security?
Developing Early Action Protocol (EAP) by IFRC, National Redcrooss, other stakeholder :
- What is the mechanism of developing Impact based weather forecast (IFB) and District wise Anticipatory Early Action Protocol (EAP) to be developed ( with 5W) structures ?
- What are the Forecast based EAP and Forecast based Financing Mechanism (FBF) and humanitarian resources allocations ( UN HCT-CERF/DERF-Track funds, UN-Cluster HPC- intervention , UH-Agency pool-fund , Government Contingency Funds, Local Government Contingency Funds, I-NGOs CSO, CBO, Charities, and other non-stakeholders funds ) on the basis of SADDD( so that no highly vulnerable women, adolescents, children and other vulnerable are equally being prioritized)
- District wise Warly warning early action plan ( based on early development EAP) – 5W( who will do ,what, when , where and how) Humanitarian contingencies ( must address comply SADDD)
- based on the localized impact category, risk and vulnerabilities, what are the District wise Anticipatory Early Action Protocol (EAP) to be developed ( with 5W) structures ?
- What are the Forecast based EAP and Forecast based Financing Mechanism and humanitarian resources allocations ( UN HCT-CERF/DERF-Track funds, UN-Cluster HPC- intervention , UH-Agency pool-fund , Government Contingency Funds, Local Government Contingency Funds, I-NGOs CSO, CBO, Charities, and other non-stakeholders funds ) on the basis of SADDD( so that no highly vulnerable women, adolescents, children and other vulnerable are equally being prioritized)?
8) District wise Warly warning early action plan ( based on early development EAP) – 5W( who will do ,what, when , where and how) Humanitarian contingencies (using the sex, age, disability disaggregated data -SADD) ?
A. Questionnaire: Early Warning, Alerting & Observation Systems
You can number this as a new section in your tool (e.g. Section 8: Early Warning & Observation Systems).
8.1 Geospatial server–based alerting and dashboards
- Geospatial server and web-based platforms
- Is there a geospatial server / web-GIS platform used for real-time or near–real-time early warning and alert visualization?
- ☐ Yes ☐ Partially ☐ No
- If yes, please specify:
- Hosting institution (NMHS, DRM authority, university, etc.):
- Main functions:
- ☐ Display of hazard forecasts (cyclone, flood, drought, etc.)
- ☐ Live or near–real-time monitoring (water levels, rainfall, AWS)
- ☐ Display of exposure layers (settlements, infrastructure, women’s livelihoods, etc.)
- ☐ Hotspot / incident maps (flooded villages, blocked roads, damaged infrastructure)
- ☐ Other (specify):
8.2 Common Alerting Protocol (CAP) and standardized warnings
- Common Alerting Protocol (CAP)
- Does the country / agency use Common Alerting Protocol (CAP) for public warnings?
- ☐ Yes, institutionalized nationally
- ☐ Yes, pilot or partial
- ☐ No
- If yes:
- Which hazards are disseminated via CAP?
- ☐ Cyclone / storm
- ☐ Flood
- ☐ Heavy rainfall / severe weather
- ☐ Heatwave / cold wave
- ☐ Drought-related advisories
- ☐ Other (specify):
- Are CAP messages integrated with:
- ☐ Mobile networks (SMS/Cell broadcast)
- ☐ Web / app notifications
- ☐ TV & radio
- ☐ Siren systems
- ☐ Social media
- Which hazards are disseminated via CAP?
8.3 Real-time & multi-hazard alerting systems
- Real-time / near–real-time weather alerting system
- Is there a real-time weather alerting system operated by the Met / NMHS?
- ☐ Yes ☐ Partially ☐ No
- Hazard coverage:
- ☐ Cyclone & associated storm surge
- ☐ Heavy rainfall / severe local storms
- ☐ Riverine / flash floods (linked to hydro data)
- ☐ Drought / seasonal outlooks
- ☐ Strong winds, lightning, landslides, etc.
- Multi-hazard alerting
- Is there a multi-hazard alerting system (single platform/channel that covers multiple hazards)?
- ☐ Yes, fully multi-hazard
- ☐ Yes, but hazard-specific components
- ☐ No
- Does it:
- ☐ Prioritize high-risk hotspots using CRVA layers
- ☐ Allow targeted alerts (e.g. specific districts, villages, livelihood groups)
- ☐ Include clear action-oriented messages (what to do, by whom, where, when)
8.4 Hotspot tracking and incident alerting
- Hotspot monitoring and incident tracking
- Is there a system to track hotspots and incidents in real time (e.g. flooded villages, damaged infrastructure, blocked roads)?
- ☐ Yes (digital platform / app)
- ☐ Yes (manual / spreadsheet-based)
- ☐ No
- Functions (tick all that apply):
- ☐ Field teams report incidents via mobile/app
- ☐ Incidents displayed as points/polygons on GIS maps
- ☐ Integrated with EOC / command center dashboards
- ☐ Linked to resource deployment / logistics decision making
- ☐ Used to update CRVA and risk atlas after events
8.5 Incident Command System (ICS) and military involvement
- Incident Command System (ICS)
- Is an Incident Command System (ICS) or similar structure used for disaster response and early action?
- ☐ Yes, formally adopted
- ☐ Yes, partially / informally
- ☐ No
- Main lead institution:
- ☐ Disaster management authority
- ☐ Military / armed forces
- ☐ Civil defense / fire service
- ☐ Police / internal security
- ☐ Other (specify):
- Does ICS:
- ☐ Receive and act on real-time multi-hazard alerts
- ☐ Coordinate with NMHS and hydrological agencies
- ☐ Coordinate with local government and communities
- ☐ Integrate gender and protection focal points (e.g. WRD, social services)
8.6 Hybrid observation network (automated + community-based)
- Telemetric community-based flood early warning mechanisms
- Are there community-based flood early warning mechanisms using telemetric or semi-automatic gauges?
- ☐ Yes, in multiple locations
- ☐ Yes, in a few pilots
- ☐ No
- Features:
- ☐ River/stream gauges monitored by community volunteers
- ☐ Telemetric transmission (SMS, GSM, radio) to central systems
- ☐ Local warning dissemination (flags, sirens, mosque/temple/church announcements, megaphones, etc.)
- ☐ Linkage with formal national flood forecasting system
- NMHS telemetric hydrological observation system
- Does the national hydrological or water resources authority operate a telemetric hydrological network (river level, discharge, reservoir levels)?
- ☐ Yes ☐ Partially ☐ No
- If yes:
- Number of key telemetric stations (approx.):
- Are data:
- ☐ Real-time or near–real-time
- ☐ Integrated into flood forecasting models
- ☐ Shared with DRM and ICS for alerting & response
- ☐ Visualized on geospatial dashboards
- Meteorological observation network
- Automatic Weather Stations (AWS) / telemetric stations
- Are AWS deployed and operational?
- ☐ Yes, dense network
- ☐ Yes, limited / partial
- ☐ No
- Are AWS data:
- ☐ Transmitted telemetrically in near–real-time
- ☐ Used in forecasting and impact-based alerts
- ☐ Integrated into GIS/CRVA maps
- Are AWS deployed and operational?
- Human weather observers
- Are there manual / human observation stations (synoptic, agro-met, rainfall observers)?
- ☐ Yes ☐ Partially ☐ No
- Are these observations:
- ☐ Digitized / transmitted regularly
- ☐ Used to validate and calibrate AWS and models
- ☐ Feeding into early warning messages
- Are there manual / human observation stations (synoptic, agro-met, rainfall observers)?
- Integration: hybrid observation and warning chain
☐ Yes ☐ Partially ☐ No
Are all warning and alerting systems (CAP, multi-hazard alerting, hotspot incident tracking, ICS) fed by a hybrid observation network combining:
☐ Telemetric community-based EWS
☐ Telemetric hydrological network
☐ AWS and telemetric meteorological stations
☐ Human observers and community reports
Is there redundancy so that if one system fails (e.g. telecommunication outage), others (community observers, radio, local sirens) can still issue warnings?
10) Development of Point based weather, multi-hazard observation, weather outlook, weather warning, disaster alert, hotspot of the disaster incidence capture, current event situation reporting
The assessment will examine the development and use of point-based weather and multi-hazard services that provide localized forecasts, outlooks, warnings, disaster alerts, and real-time situation reports for geolocated high-value elements. These elements include settlement clusters (remote villages, small townships, municipalities and urban centers), marketplaces, industrial and mining areas, critical government and utility infrastructure, water control and hydrological structures, standing crop lands, value-chain structures, sector-specific service delivery facilities, and other critical assets.
The review will focus on the availability of a geospatial database of high-value elements, the extent to which point-based observation and forecast products are generated and updated, and how disaster incidence hotspots and current event situations are captured and mapped. It will also assess whether these point-based products are systematically used to inform humanitarian decision-making, including prioritization of locations for lifesaving assistance, pre-positioning of relief, anticipatory action, and targeted support to vulnerable settlements and livelihood systems.
10. Point-based weather & multi-hazard services for high-value elements
10.1 Geolocated “high-value elements” database
- Existence of point-based geospatial database
- Is there a point-based geospatial database (with coordinates) of high-value elements at risk?
- ☐ Yes, nationally
- ☐ Yes, in selected provinces/districts
- ☐ Pilot/partial
- ☐ No
- Types of high-value elements mapped (tick all that apply)
- Settlements & population clusters
- ☐ Clustered rural houses / hamlets
- ☐ Remote / hard-to-reach villages
- ☐ Small townships and growth centers
- ☐ Municipal / urban centers
- Economic & livelihood elements
- ☐ Markets and trading centers
- ☐ Industrial zones / factories / warehouses
- ☐ Mining areas / extraction sites
- ☐ Standing crop lands (by crop type)
- ☐ Livestock production areas
- ☐ Fisheries ponds / aquaculture farms
- ☐ Value-chain structures (collection centers, storage, processing, transport hubs, retail outlets)
- Critical government & utility infrastructure
- ☐ Government administrative offices
- ☐ Health facilities (clinics, hospitals)
- ☐ Education facilities (schools, colleges)
- ☐ WASH facilities (water treatment plants, pumping stations, reservoirs, main pipelines)
- ☐ Power infrastructure (power plants, substations, main transmission lines)
- ☐ Telecommunication hubs / data centers
- Hydrological & water control infrastructure
- ☐ Dams, barrages, regulators
- ☐ Embankments / levees / dykes
- ☐ Flood gates, sluices, regulators
- ☐ Irrigation canals, intakes, major drains
- ☐ Water structures (check dams, retention ponds, tanks, etc.)
- Other critical structures
- ☐ Disaster shelters and safe buildings
- ☐ Key logistics hubs (ports, major bridges, bus/rail terminals)
- ☐ Strategic storage for food/relief items
- ☐ Other (specify):
- Attributes recorded for each point
- ☐ Type and function of element
- ☐ Ownership / managing agency
- ☐ Population served / dependent users
- ☐ Historical flood level / hazard impact history
- ☐ Sensitivity to specific hazards (flood, cyclone, drought, landslide, etc.)
- ☐ Criticality classification (e.g. high / medium / low)
- ☐ Linkage to SADDD / gender data (e.g. service used by women-headed households)
10.2 Point-based weather, multi-hazard observation & outlook products
- Point-based weather observation
- Are point-based weather and hydrological observations (e.g. from AWS, rain gauges, river gauges) linked directly to high-value elements?
- ☐ Yes, systematically
- ☐ Yes, partially
- ☐ No
- Point-based weather outlook and warnings
- Does the Met / NMHS or DRM authority produce point- or location-based:
- ☐ Short-term weather forecasts (daily/3-day) for specific settlements and key structures
- ☐ Multi-day weather outlooks for key livelihood and infrastructure points
- ☐ Hazard-specific alerts (e.g. river level exceeding danger near a specific town, strong winds near an industrial zone)
- Are these products:
- ☐ Generated automatically through a GIS/database system
- ☐ Manually interpreted and issued by forecasters
- ☐ Not yet produced
- Multi-hazard point-based warning
- For the mapped high-value elements, are there point-based multi-hazard warnings (not just district-level)?
- ☐ Yes, multiple hazards (flood, cyclone, heavy rainfall, etc.)
- ☐ Yes, for some hazards only
- ☐ No
- Are thresholds defined at element level, e.g.:
- ☐ Water level at X gauge threatening Y settlement
- ☐ Rainfall intensity over Z catchment threatening specific villages
- ☐ Wind speed forecast threatening specific industrial facilities or power lines
10.3 Disaster incidence hotspots & current event situation reporting
- Hotspot capture of disaster incidents
- Is there a system to capture disaster incidents at point level, such as:
- Flooded villages / neighborhoods
- Damaged or non-functional infrastructure (roads, bridges, schools, health centers, power, water points)
- Disrupted markets, industry, mining sites
- Losses to standing crops and key livelihoods
- Reporting mechanism:
- ☐ Mobile or web-based incident reporting app
- ☐ Phone/SMS-based reporting consolidated into a map
- ☐ Paper-based forms later digitized into GIS
- ☐ Ad hoc / not standardized
- Current situation reporting (situation reports, sitreps)
- During an event (e.g. flood, cyclone), are current situation reports generated that:
- ☐ Use point-based maps of high-value elements affected
- ☐ Summarize impacts by element type (settlements, markets, infrastructure, crops, etc.)
- ☐ Identify access constraints and isolated locations
- ☐ Feed into national/provincial EOCs and ICS for decisions
- Frequency of updates:
- ☐ Real-time / daily
- ☐ Every few days
- ☐ Only once per major event
- ☐ Irregular
10.4 Use for humanitarian actions and decision-making
- Use of point-based products to inform humanitarian action
- Are point-based weather, hazard outlooks, warnings and incident/hotspot maps explicitly used to:
- ☐ Prioritize locations for evacuation and lifesaving support
- ☐ Decide where to pre-position food, NFIs, WASH supplies, medical items
- ☐ Trigger anticipatory actions (cash transfers, livelihood protection, movement of livestock, protection of assets)
- ☐ Plan access routes and logistics (roads, bridges, alternative routes)
- ☐ Target support to particularly vulnerable settlements (e.g. remote villages, informal settlements, women-headed household clusters)
- Formal linkages and SOPs
- Are there formal SOPs or decision trees that connect:
- Point-based warnings →
- Hotspot/impact maps →
- Pre-defined humanitarian actions and resource allocation?
- ☐ Yes, clearly documented
- ☐ Yes, but informal / partial
- ☐ No
- Gender and inclusion in point-based actions
- Do point-based products include or link to:
- ☐ Data on women-headed household clusters
- ☐ Locations with high proportion of vulnerable groups (persons with disabilities, elderly, etc.)
- ☐ Women’s livelihood elements (markets, processing centers, farmlands, ponds)
- Are these used to prioritize assistance and protection measures for women and vulnerable groups?
- ☐ Yes ☐ Partially ☐ No
B. What are the key gaps and how has the crises impacted on these key gender gaps
1) Availability of gender responsive preparedness plan for cyclone ?
11. CRVA-Guided Preparedness Planning, Evacuation & Sectoral Readiness
11.1 CRVA-guided preparedness plan, maps and risk atlas
- Existence of CRVA-guided preparedness plan
- Is there an emergency preparedness plan explicitly guided by CRVA (multi-hazard & climate risk and vulnerability assessment)?
- ☐ Yes, nationally
- ☐ Yes, sub-nationally (province/district)
- ☐ Yes, at local level (municipality / sub-district / village)
- ☐ Partially / pilot only
- ☐ No
- Does the plan:
- ☐ Show all key elements at risk on maps (settlements, infrastructure, livelihoods, services)
- ☐ Use risk ranking (e.g. very high / high / medium / low) by area or element
- ☐ Include a Risk and Vulnerability Atlas (printed or digital)
- ☐ Show locations of vulnerable women-headed households based on SADDD
- ☐ Integrate gender and social vulnerability narrative analysis
- Risk and Vulnerability Atlas
- Is there a Risk and Vulnerability Atlas that:
- ☐ Is multi-hazard (cyclone, flood, drought, others)
- ☐ Shows exposure and vulnerability of key sectors and elements
- ☐ Highlights clusters of vulnerable women, children, elderly, persons with disabilities
- ☐ Is updated regularly and used in planning exercises
11.2 Evacuation planning, routes, shelters and coordination
- Evacuation route mapping and guidance
- Do GIS and geospatial map–based guidelines exist showing:
- ☐ Official evacuation routes from villages and settlements
- ☐ Alternative routes for floods, road blockage, bridge damage
- ☐ Mode of transport for evacuation (boat, truck, bus, non-motorized, etc.)
- ☐ Key constraints (narrow roads, weak bridges, waterlogged areas, landslide-prone sections)
- Are these routes:
- ☐ Printed and shared with communities
- ☐ Available in digital/webGIS form
- ☐ Displayed at community notice boards/shelters
- Shelter mapping and classification
- Do GIS maps show all types of shelters and safe structures?
- ☐ Core family shelters
- ☐ Public disaster shelters / cyclone shelters
- ☐ Multi-purpose community centers used as shelters
- ☐ Schools and public buildings designated as temporary shelters
- ☐ Government installations that can be used for sheltering in emergencies
- Are shelters mapped with attributes like:
- ☐ Capacity (number of people)
- ☐ Structural safety (cyclone/flood resistance)
- ☐ Accessibility for women, children, elderly, persons with disabilities
- ☐ WASH facilities, lighting, privacy arrangements
- Forecast-based evacuation triggers and stages
- Are there national forecast-based guidelines on:
- ☐ When to begin evacuation preparation based on cyclone stage / warning level
- ☐ When women, children, elderly and persons with disabilities should move to shelters
- ☐ Who orders evacuation (which authority, at which warning level)
- Are the guidelines:
- ☐ Clearly linked to official forecast stages (e.g., watch, warning, danger)
- ☐ Communicated regularly to local government and communities
- ☐ Used in simulation/drills
- Stakeholder coordination map and guideline
- Is there a stakeholder coordination map for preparedness and evacuation that shows:
- ☐ Lead and supporting institutions at each level (national, provincial, district, municipality, village)
- ☐ Roles of local government, CPP/volunteers, military, NGOs/CSOs, women’s groups, etc.
- ☐ Lines of communication and reporting (who informs whom, and how)
- Are there written guidelines/SOPs describing:
- ☐ Roles and responsibilities in evacuation and shelter management
- ☐ Coordination with the Emergency Operations Center (EOC) and Incident Command System (ICS)
- ☐ Coordination with gender and protection actors
11.3 Gender-sensitive evacuation, sheltering and pre-positioning
- Guidelines for gender-friendly evacuation and sheltering
- Are there formal guidelines that address:
- ☐ Gender-sensitive evacuation (ensuring safe, dignified movement for women and children)
- ☐ Special assistance for pregnant and lactating women, persons with disabilities, elderly
- ☐ Protection from GBV and exploitation during evacuation and at shelters
- Are these guidelines:
- ☐ Known to local authorities, CPP volunteers and security forces
- ☐ Explained to communities
- ☐ Practiced through drills
- Gender sensitivity and safety in shelter guidelines
- Do disaster shelter guidelines include:
- ☐ Separate spaces or partitions for women and families
- ☐ Secure, gender-sensitive WASH facilities (separate toilets, bathing spaces, lighting)
- ☐ Safe sleeping arrangements for women and children
- ☐ Codes of conduct and complaint mechanisms for GBV and harassment
- ☐ Inclusion of women in shelter management committees
- Shelter status and pre-positioning information
- Is there a system (map or database) showing shelter status, including:
- ☐ Availability and pre-positioning of relief items (NFIs, hygiene kits, dignity kits)
- ☐ Food stocks and cooking arrangements
- ☐ Basic medical and first aid supplies
- ☐ Water and sanitation facilities
- ☐ Power and lighting
- Is this information:
- ☐ Updated before hazard season
- ☐ Accessible to decision-makers at EOC/ICS
- ☐ Used to identify gaps and prioritize logistics
11.4 Sectoral operational preparedness plans & forecasts
- Agriculture sector operational preparedness
- Are there sector-specific operational preparedness plans for agriculture that include:
- ☐ Forecast-based estimates of possible loss and damage to standing crops
- ☐ Early action advice so women smallholder farmers can protect crops, fisheries, livestock
- ☐ Recommended measures (e.g. early harvesting, drainage management, fodder storage, moving livestock, protecting seed and inputs)
- Are these operational forecasts and advisories:
- ☐ Location-specific (district/village level)
- ☐ Time-specific (linked to forecast dates and lead times)
- ☐ Disseminated through channels accessible to women (radio, SMS, local meetings, women’s groups, extension workers, etc.)
- Preparedness guidelines for other key sectors
For each sector below, indicate whether there are written preparedness guidelines and operational forecasts/risk outlooks informed by CRVA:
- Nutrition
- ☐ Guidelines ☐ Operational outlooks ☐ Neither
- Transport, logistics and communication
- ☐ Guidelines ☐ Operational outlooks ☐ Neither
- Food security & livelihoods
- ☐ Guidelines ☐ Operational outlooks ☐ Neither
- Shelter and Camp Management
- ☐ Guidelines ☐ Operational outlooks ☐ Neither
- Water, Sanitation and Hygiene (WASH)
- ☐ Guidelines ☐ Operational outlooks ☐ Neither
- Health
- ☐ Guidelines ☐ Operational outlooks ☐ Neither
- Protection (including GBV, child protection)
- ☐ Guidelines ☐ Risk alerts/outlooks ☐ Neither
- Do these sectoral plans:
- ☐ Explicitly reference CRVA/risk atlas
- ☐ Include gender and age-specific responsibilities and actions
- ☐ Include triggers for anticipatory action and early response
- Functional map of sectoral stakeholders
- Is there a functional stakeholder map showing:
- ☐ Lead sector ministries and agencies
- ☐ Local government roles
- ☐ NGOs/CSOs and UN/INGO partners
- ☐ Private sector (transport, telecoms, logistics, agri-business)
- ☐ Community structures, women’s groups, CBOs
11.5 Gender-responsive operational forecasts
- Operational forecasts for women-headed smallholder farmers
- Are operational weather and agrometeorological forecasts specifically designed for smallholder farmers, including women-headed households?
- ☐ Yes ☐ Partially ☐ No
- Content includes:
- ☐ Short-term weather (rainfall, temperature, wind)
- ☐ Water stress/drought indicators
- ☐ Crop-stage specific advice (sowing, fertilizer, pest control, harvesting)
- ☐ Advice for fisheries and livestock
- Are these forecasts:
- ☐ Tailored to local languages and literacy levels
- ☐ Communicated through farmer field schools, women’s groups, extension, radio/SMS, apps
- ☐ Monitored for reach and usefulness among women-headed households
- Geospatial tools for managing women-headed household risk
- Are operational forecasts integrated into geospatial tools targeted at women-headed households, such as:
- ☐ Maps highlighting locations of women-headed households in high-risk zones
- ☐ Dashboards showing forecasted hazard impacts on these locations
- ☐ Target lists for forecast-based cash or in-kind assistance
- ☐ Tools used by local government/NGOs to prioritize outreach and preparedness support
11.6 EOC, CPP and humanitarian operational guidelines
- Emergency Operations Center (EOC) functional guidelines
- Does the EOC have written functional guidelines/SOPs that:
- ☐ Integrate CRVA, risk atlas and sectoral risk information
- ☐ Define how warnings and forecasts trigger actions
- ☐ Define roles for each cluster/sector (health, WASH, shelter, protection, etc.)
- ☐ Include gender and protection responsibilities (WRD, social services, GBV focal points)
- Cyclone Preparedness Program (CPP) guidelines
- Are there operational guidelines for the Cyclone Preparedness Program (CPP) (or equivalent community-based warning and evacuation program) that cover:
- ☐ Early warning dissemination and last-mile communication
- ☐ Evacuation support, especially for women, children, elderly, and persons with disabilities
- ☐ Coordination with local government, EOC, and humanitarian partners
- ☐ Gender-sensitive volunteer conduct and protection standards
- Humanitarian action guidelines
- Are there national or sub-national humanitarian guidelines that:
- ☐ Define minimum standards for shelter, WASH, health, food security, protection, etc.
- ☐ Incorporate gender, age, disability and protection considerations
- ☐ Are explicitly linked to CRVA and forecast-based triggers (anticipatory action)
- Operational guidelines of all stakeholders with 5W.
C. What are the key gaps and how has the crises impacted on these key gender gaps
[1] Showed in below diagram
- I-NGOs support Protection in reducing Prevention of sexual exploitation and abuse (PSEA) and Sex and Geder Based Violence (SGBV) during disaster emergency.
- Local level stakeholder map
- Identification of root causes and strategy development for reduction PSEA and SGBV.
| Improving strategy, informed planning process | Programmatic & Intervention support | Barrier / Gap for reinforcement of protection mechanism for reducing PSEA and SGBV during disaster emergency | Recommendations |
| Local level stakeholder map | District level stakeholder map, coordination and partnership with multi-stakeholders in planning, project implementation and avoiding duplicity of interventions, identifying the intervention gaps gap in hard-to-reach aeras | Agreed stakeholder coordination map for intervention planning and scheme implementation. | |
| Identification of root causes and strategy development for reduction PSEA and SGBV. | Stakeholder coordinated strategic assessment for Identification of root causes for incidence of PSEA and SGBV during disaster emergencies.1)Capacity enhancement program of District & village level stakeholder/actor/coordination group, volunteer capacity/functional map Capacity building of duty bearer (line ministry and duty bearers in intervention design and implementation for root cause identification for reducing PSEA and SGBV and other forms of violence Capacity building in improving Coordination and partnership mechanism of local actors, Technical working group, women led organizations, right based organization, law and over reinforcing organization ( Defense force/police, community police) in networking, incidence reporting, alerting . | Lack of Information management system, situation reporting, dissemination, government media outlets based awareness campaign, incidence reporting and accessing legal aid.Institutional policy and strategy, programmatic and interventions gaps in reducing PSEA and SGBVEmergency shelter planning for vulnerable women, adolescence girls headed households What are internal factors accessing services of emergency shelter, NFI, food, water security are the factors affecting incidence of PSEA and SGBV during disaster emergency?Protection cluster intelligence , idea, sharing for reducing PSEA and SGBV | |
| Protection community from PSEA, Sex and Gender Based Violence (SGBV) | 1) Stakeholder coordinated mechanism during disaster emergency (cyclone, foods) for reducing PSEA and Protection from Sexual and Gender Based Violence (SGBV) at the remote affected areas 2)Stakeholder map for the this purposes ( UN Women, UNFPA, UNICEF, UNDP, I-NGOS, Government duty bearer, local actors, private sector) for protecting female from violence | Weakness of Community led protection mechanism against the SGBV, PSEA and other gender-based violence while marooned community area isolated by devastating flooding/clones for longer period. | |
| What are the systemic gaps of planning and actionable interventions are for securing gender protection until community resilience building in livelihood security are achieved? | |||
| How to improve the service (women/adolescent girls grouped policing) deliveries, community /individual awareness during crisis ? | |||
| Activation of Alerting and Early warning system over the cell phone | Nexus building with government telecommunication ministry, cellular phone company for transmitting and dissemination of toll-free messaging | What is the weakness, strength, opportunities protection cluster identified implementing the alerting and warning mechanism.Responsibility of government media outlets in awareness raising and alerting Barrier of activation PSEA info platform, making government duty bearer held accountable to reducing the PSEA risk during disaster emergencies.Stakeholder coordinated policy and programmatic and intervention of implementation of IASC collective actions plans on Accountability to Affected Population (AAP) |
- I-NGOs support the strengthening Food Security governance system:
| Food Security Strategy support for improving strategy, informed planning process | Intervention/support for emergency food security during disaster | Barrier / Gap identification for ensuring local level Food Security | Recommendations |
| Mobile money-based e-voucher system for purchasing food items as forecast based humanitarian assistance mobilization. | Community to access the nearest service trigger point for obtaining and stocking emergency foods (Energy biscuits/nutritional dry foods) sufficiently for surviving at least two weeks for remote/hard-to-reach Women headed households after early warning being issued | Institutional capacity, coordination gap in installation of operational value chain for trigger points emergency food supply.Based on flood and cyclonic hazard prone risk atlas/informed tools – government initiatives for installation remote multi-purpose silos /warehouse/cold storages for protection community assets and food grain from flash floods, – What are the indicative barrier implementation of the services ? strategy, tools gap, capacity gap, resource gap for implementing the schemes. | |
| Installation of evidence-based decision-making system | 1)Supporting UN Cluster FSC approach and enhancing Stakeholder capacity and coordination creating ICT based and evidence based multi-factors linkage for affected household level food security e.g. hydrometeorological hazard and disaster, water stress (drought), soil fertility loss, crop loss and yield loss, poverty laden households, income poverty etc. and how those factors could potentially impact food security. In this aspect what about FSC strategic approach of harmonizing an synchronizing multicriteria based local level ( district and village level food security early warning mechanism for vulnerable community, households. 2)Developing with evidenced based system for program/ projects development in integrated farm management (IFM), water, soil, ecology management and intrigued Nutrition management (INM) for ensuring household food security | ICT and GIS based tools for developing integrated food security early warning system at district level.Government strategy and project development on One-stop solution to integrated food, nutrition and famine and health security. | |
| Ensuring production of adequate food supply, Securing access to available foods, Food availability, Food access, Food utilization, Stability, Maximizing stability in the flow of supplies | The Supporting UN FSC strategy, Government coordination and programmatic and project support for boosting food production ( with selection of suitable crops) during normal time. I-NGOs support for identifying district level incentives demands sustainable income generating activities (IGA) and Providing incentives and DFS(mobile money ) for marginalized women headed farmers in boosting agro-crop production, storage facilities , accessing AVC input supply facilities and boosting household economy.Government sectoral capacity development in this regard for ensuing Ensuring production of adequate food supply.Strategy, program and project development for Sustainable land, Agroecology, ecosystem, IWRM, for subsistence and conservation agricultural production for food production | Government and Local stakeholders ( Women headed AVC operators , input suppler, seed , seedling, sapling suppler, horticulture, storage facilities, green shed, market player, water and irrigation facilities, logistics and transport operations ) capacity, coordination mechanism in AVC, green entrepreneurship, small holder farming, IFM development for boosting food production at the district and local level. DFS and incentives for developing women headed fisheries and livestock farming and value chain development . | |
| FSC strategic support to stakeholders in accessing web-based Information Management (IM) tool | I-NGOs District level coordination and programmatic and project support for developing district level coordination mechanism of stakeholders on 5Ws ( Who does What, Where, When and for Whom) of agro services for accessing local agroecological resources, IWRM, Rainwater harvesting, Drip irrigation, Judicial uses of water resources, agrotechnology, farming practices, AVC support services, market access, women headed green entrepreneurship development, household level IFM practices etc related IM tools, messaging system for the women farmers. | What are the existing institutional and stakeholder led mechanism , functional and coordination barrier ?Development of geospatial portal and mobile apps showing geospatial services for accessing the small holder farmers and women having android cell phone and mobile networks, and SMS for the other users. | |
| The Famine Early Warning Systems Network (FEWS) | I-NGOs District level programmatic and project support for developing district developing gender responsive FEWS, anchoring global and regional FEWS at country, and local level, giving access to stakeholder and vulnerable households for warning, alerting and taking sustainable action for mitigating impending crisis. | What are the existing institutional and stakeholder led mechanism, functional and coordination barrier of accessing and anchoring FEWS and developing and activation of district level FEWS system ? |
- I-NGOs support the WASH services delivery :
| WASH support for improving strategy, informed planning process | Intervention/support for WASH delivering Services at Local level | Barrier / Gap for conducting WASH service at local level | Recommendations |
| Principles of coordinated partnership, promoting effective and accountable humanitarian water, sanitation and hygiene (WASH) coordination | I-NGOs District level programmatic and project support for the Field Support Team (FST) mechanism, women leaders for rendering WASH services to women headed householdsCoordination mechanism of National Coordination Platforms (NCPs) support for strengthening partnerships, and the predictability and accountability of humanitarian action, by improving prioritization and clearly defining the roles and responsibilities of humanitarian organizations | Tools and process gap for analysis of humanitarian needs and coordination capacity on the ground, in consultation with national partners.I-NGOs identified Challenges of Community Led Total Sanitation (CLTS)Constraints developing of Geographic Information System (GIS) in order to continuously map out water points, WASH Structures, distance from women headed household I-NGOs coordination for Water and Environmental Sanitation Network (WESNET)I-NGOs identified coordination and functional gaps working participation of district development planning, working with Distinct/village level Stakeholder Government transparency and accountability financing of huge water projects by making publicly available information on loans, as well as terms and conditions of repayment.I-NGOs identified challenges of emergency rapid assessment expertise for WASH (water, hygiene, sanitation, waste management), vector control and infection control inventory and needs in the health facilities and for the health activities in response to the emergency situation.I-NGOs identified challenges Forecast based early action panning and supplying water treatment kits, facilities to women headed household, community level for health safety. | |
| Supporting service delivery | Working for the district government agreed platform to ensure that service delivery is driven by the gender responsive agreed strategic priorities, mandates, accountability at the local level.I-NGOs support for developing mechanisms to eliminate duplication of service delivery (online platform) .I-NGOs support for integrated health (kits)and WASH service delivery for vector control and infection control activities are conducted and set up in the health facilities in compliance with Sphere and Standard | I-NGOs identified challenges of households and shelters rationing water supplies for drinking and cooking. Challenges risk of diarrheal diseases. | |
| Informing strategic decision-making | I-NGOs support for conducting SADD survey and developing district level informed tools for strategic decision-making of the improved Humanitarian Coordinator (HC) for the humanitarian responseI-NGOs support for conducting Needs assessment and response gap analysis (across sectors and within the sector), Analysis to identify and address (emerging) gaps, obstacles, duplication and cross-cutting issues, Prioritization, grounded in response analysis.I-NGOs led supports to ensure applicability and appropriate implementation of the recommended infection control activities in the health facilities and for the health activities, specifically for medical waste management, safe and dignified burial of infectious bodies, health staff and patients protection.Monitor and report on country progress on WASH activities within the health facilities and for health activities in the context of the incident management system. Evaluate gaps and needs and propose remedial actions for improvement.Secure water, hygiene, sanitation and infection control expertise within the WASH cluster, providing implementation guidance. | Indicative gaps in developing and implementation of informed tools , utilization of SADDD, multi-hazard and climate risk and vulnerability informed tools in planning of WASH services at community level. Indicative gaps in developing gender responsive Forecast based early WASH service at community level. Disaster /Flood proof WASH structure planning and installation for service remote community. | |
| Planning and strategy development | I-NGOs support for development of sectoral plans, objectives and indicators that directly support the realization of the HC/HCT strategic priorities, Apply and adhere to existing standards and guidelines, assessment of funding requirements, prioritization, and cluster contributions for the HC’s overall humanitarian funding considerations (e.g. Flash Appeal, Consolidated Appeal Process (CAP), Central Emergency Response Fund (CERF), Emergency Response Fund/Common Humanitarian Fund) | What are indicative emergency planning, resource mobilization gaps relating to pre-positioning modular/handy/removable/ /family level deployable water treatment kits, rainwater harvesting kit to every individual households are vulnerable to impeding hazards ? Evaluation of current capacity of stakeholders Current capacity to plan the effective delivery of WASH servicesCurrent status of service delivery models regarding challenge areas Current status of community involvement in planning, monitoring and evaluation processes at different levelsCurrent status of community regarding claiming their rights for WASHCurrent status of active participation of people from marginalized and socially excluded groups.Current status regarding knowledge and understanding of the media to effectively engage in WASH promotion.Current status of clear roles and responsibilities for delivery, management and financing of WASH servicesCurrent condition of coordination mechanisms for WASH actors working at national/district levelPercentages of schools with gender segregated WASH facilities.Percentages of schools with WASH facilities that are accessible for children with disabilityPercentages of health facilities with basic WASH facilities | |
| Monitoring and reporting | I-NGOs support for monitoring and evaluation of the implementation of the cluster strategy and results; recommending corrective action where necessary. Support for WASH cluster mechanism of monitors the performance the core functions for each National Coordination Platforms (NCPs), the Cluster Coordination Performance Monitoring (CCPM) and Requirements for Coordination. | Conducting household survey and developing SADDD on necessity of integrated primary health care and WASH services at community level and addressing gender inequality of selecting beneficiaries Online geospatial tools for tracking WASH facility. Status of structures are functional and damaged by cyclone and floods.Status monitoring of women headed WASH facility • Aligning Water Sanitation and Hygiene (WASH) for wall program with UNICEF lead clusters and Areas of Responsibility (AoRs) • I-NGOs support implementing standard operating procedures (SOPs) for monitoring WASH facility , Capacity enhancement of Technical working groups on specific topics related to coordination, to improve WASH response during disaster emergency, coordination and partnership with the WASH cluster coordination mechanism, partnership mapping, WASH service status monitoring with all WASH actors at district level with government entities, local NGOs, INGOs, development NGOs, academia, private sector – to find solutions to issues arising in a continuation of emergency response services. I-NGOs Accountability for ensure that responses are accountable and reflect the needs of affected populations | |
| 1) I-NGOs support for GIS risk atlas on WASH structures, service trigger points, hazard proof emergency WASH service trigger points considering the colossal level of impending hazard and disaster risks are highly likely to impact remote community/households likely to be isolated , hard-to-reach and remoteness . 2) I-NGOs support for Mapping capacity of state and non-state actors on planning, resource mobilization of installation of hazard proofing WASH structures at remote and hard-to-reach areas. State and non-state actors capacity & resource gaps in pre-positioning emergency water treatment kits, items, system, rainwater harvesting kits so that affected community can have access to lifesaving WASH services until disaster emergency conditions are improving. | Status of government capacity gaps in planning & implementation of crisis response programs (Preparedness, Response, Early Recovery, Reconstruction) ?Stakeholders (state, non-state) Capacity gaps, root level service provider (Health surveillance assistants ) in implementing much needed building back better(BBB) interventions ?Capacity gaps in timely planning and mobilizing uniform and equal response to all disaster impacted all administrative levels/localities (hard-to-reach area)?District and village level, hard-to-reach area WASH service capacity gaps in mobilizing lifesaving humanitarian assistance (hard-to-reach area)?Humanitarian assistance Mobilization of logistic, transport, communication, barrier in ( hard-to-reach area) in post-disaster colossal damage emergencies ?Capacity gaps in continuation of education in disaster affected areas ? Time required for functioning of WASH facilities in educational institutes ?Dropouts of students aftermath of disaster effects( storm, floods, drought etc.) Strategic campaign for emergency WASH and sanitation services for adolescence girls for reducing dropouts of female students and reducing /retention of female students |
- I-NGOs support the Health Services at District and Village :
| Support for improving strategy, informed planning process | Intervention/support for Health Services at Local level | Barrier / Gap for conducting public health services | Recommendations |
| INGO led coordinated partnership, promoting effective and accountable integrated health and WASH coordination mechanism at district and village level | Coordinating : Coordination mechanism integrated health and WASH service delivery by National Coordination Platforms (NCPs) support for strengthening partnerships, and the predictability and accountability of service requirements over the humanitarian action, by improving prioritization and clearly defining the roles and responsibilities of humanitarian organizations Health service governance improvement at local level : Creating stakeholder accountability and monitoring mechanism of full scale District Health Service (DHS) online monitoring mechanism of integrated primary heath care services and WASH facilities in order to facility online service delivery performance monitoring and governed system to avoid discrimination service deliveries of women header household and hart-to-reach areas National coordination structures for responding to epidemic outbreaks, address health inequalities among underserved populations and increase access for better water, sanitation and hygiene services through community-based health interventions. It will also use this approach to position itself as a key public health actor in the response to epidemic outbreaks. | Gaps and barriers of integrated health and WASH service delivery at village level , hard-to-reach areas. Stakeholder coordination respond to combat epidemic outbreaks, address health services inequalities and gender discrimination among underserved populations, and increase access for better water, sanitation and hygiene services through community-based health interventions of public health actors in the response to epidemic outbreaks. Constraints developing of GIS map based informed tools for planning and implementation of integrated health and WASH services , continuously map out primary health service, distance from women headed household , primary health care network and linkages with Water and Environmental Sanitation Network (WESNET)Distinct level Stakeholder coordination and functional barrier, Government transparency and accountability financing of primary health care facilities. Challenges of emergency rapid assessment expertise for integrated health and WASH (water, hygiene, sanitation, waste management), vector control and infection control inventory and needs in the health facilities and deployment of the emergency public health care services in response to the emergency.Forecast based early action spread of outbreaks of disease and epidemics, stock taking of primary healthcare service points (treatment kits) , facilities to women headed household, community level for health safety. | |
| INGO led Supporting service delivery | Develop online geospatial platform ensure that service delivery complying the gender inequality and hard-to-reach areas with local stakeholder accountability to affected population (AAP) mechanism. Develop mechanisms to eliminate duplication of service delivery. Intervention on supplying primary health care water treatment kits for reducing the diarrhea , cholera vector borne and infection for reducing mortality during disaster onset. | What are the challenges addressing integrated healthcare and WASH service deliveries to community level (women headed households) and continuation of primary health care services when physical communication breakdown. | |
| INGO led Informing strategic decision-making | Development of Informed integrated Health and WASH planning tools to Inform strategic decision-making of the Humanitarian Coordinator (HC)/Humanitarian Coordination Team (HCT) for the humanitarian response:Needs assessment and response gap analysis of availability of primary health care clinics at local level. Informed tool of geospatial service-based mapping and planning of primary health care community level clinic and activities within the health facilities and for health activities in the context of the disaster emergency management system. Evaluate gaps and needs of rural community clinics in hard-to-reach areas. | 1)Conducting household survey and developing SADDD on necessity of integrated primary health care and WASH services at community level and addressing gender inequality of selecting beneficiaries 2) Capacity gap of public healthcare service deliveries to community level based on Forecast based early actions of supplying of early primary health care kits (medicines and water treatment kits) at community level. Development of GIS and Geospatial map based online altering system of necessary of emergency integrated rural primary healthcare services and WASH services governance system so that urgently can mobilizes services to most affected community, women headed household. | |
| Planning and strategy development | Mapping of Disaster /Flood proof integrated rural health care service clinics/points and WASH structure planning and installation for service remote community. Assessment of Women and girls vulnerable of accessing water and sanitation as it threatens their security, well-being, and education.Stakeholder service delivery accountability to affected population (AAP) | What is indicative emergency planning, resource mobilization gaps relating to pre-positioning modular/handy/removable/ /family level deployable water treatment kits, rainwater harvesting kit to every individual households are vulnerable to impeding hazards? Stakeholder Coordination mechanism of women entrepreneurship development of running community-based primary health services to households through a community participatory approach ? | |
| Monitoring and reporting | 1) INGO support for developing online DHS portals showing all health care facilities, stocks of services available, equipment and tools required for considering the flood, cyclone and drought early warnings etc., Informed tools based online (Geospatial map-based) monitoring mechanism of integrated WASH and primary health care service trigger points. 2) Monitoring and evaluation of the implementation of the health care facilities and recommending new service installations where necessary for addressing the needs of disaster emergency. | Online geospatial tools for tracking primary health care units, WASH facility. Status of structures are functional and damaged by cyclone and floods. Status monitoring of women headed service of health care facility. • Local Level standard operating procedures (SOPs) providing primary health care facilities at community level . | |
| 1) GIS risk atlas on heal care service trigger points, primary health care clinics monitoring and reporting in disaster emergency. | Planning of preposition Integrated Primary health care kits, WASH with humanitarian assistance Mobilization of hard-to-reach area aftermath of cyclone and flood disaster response. Status of government capacity gaps in planning & implementation of integrated primary heath care and WASH services as crisis response programs (Preparedness, Response, Early Recovery, Reconstruction). Stakeholders (state, non-state) Capacity gaps, root level service provider (Health surveillance assistants ) in implementing much needed building back better(BBB) interventions .Capacity gaps in timely planning and mobilizing uniform and equal response addressing SADD requirements to all disaster impacted all administrative levels/localities (hard-to-reach area). District and village level, hard-to-reach area healthcare service capacity gaps in mobilizing lifesaving healthcare humanitarian assistance (hard-to-reach area)? |