Integrated Risk Governance Ecosystem for Operationalizing the Minimization of Loss and Damage (L&D)
Strong guidance issued to the Santiago Network on Loss and Damage ( www.santiago-network.org ) – Issued by Z M Sajjadul Islam
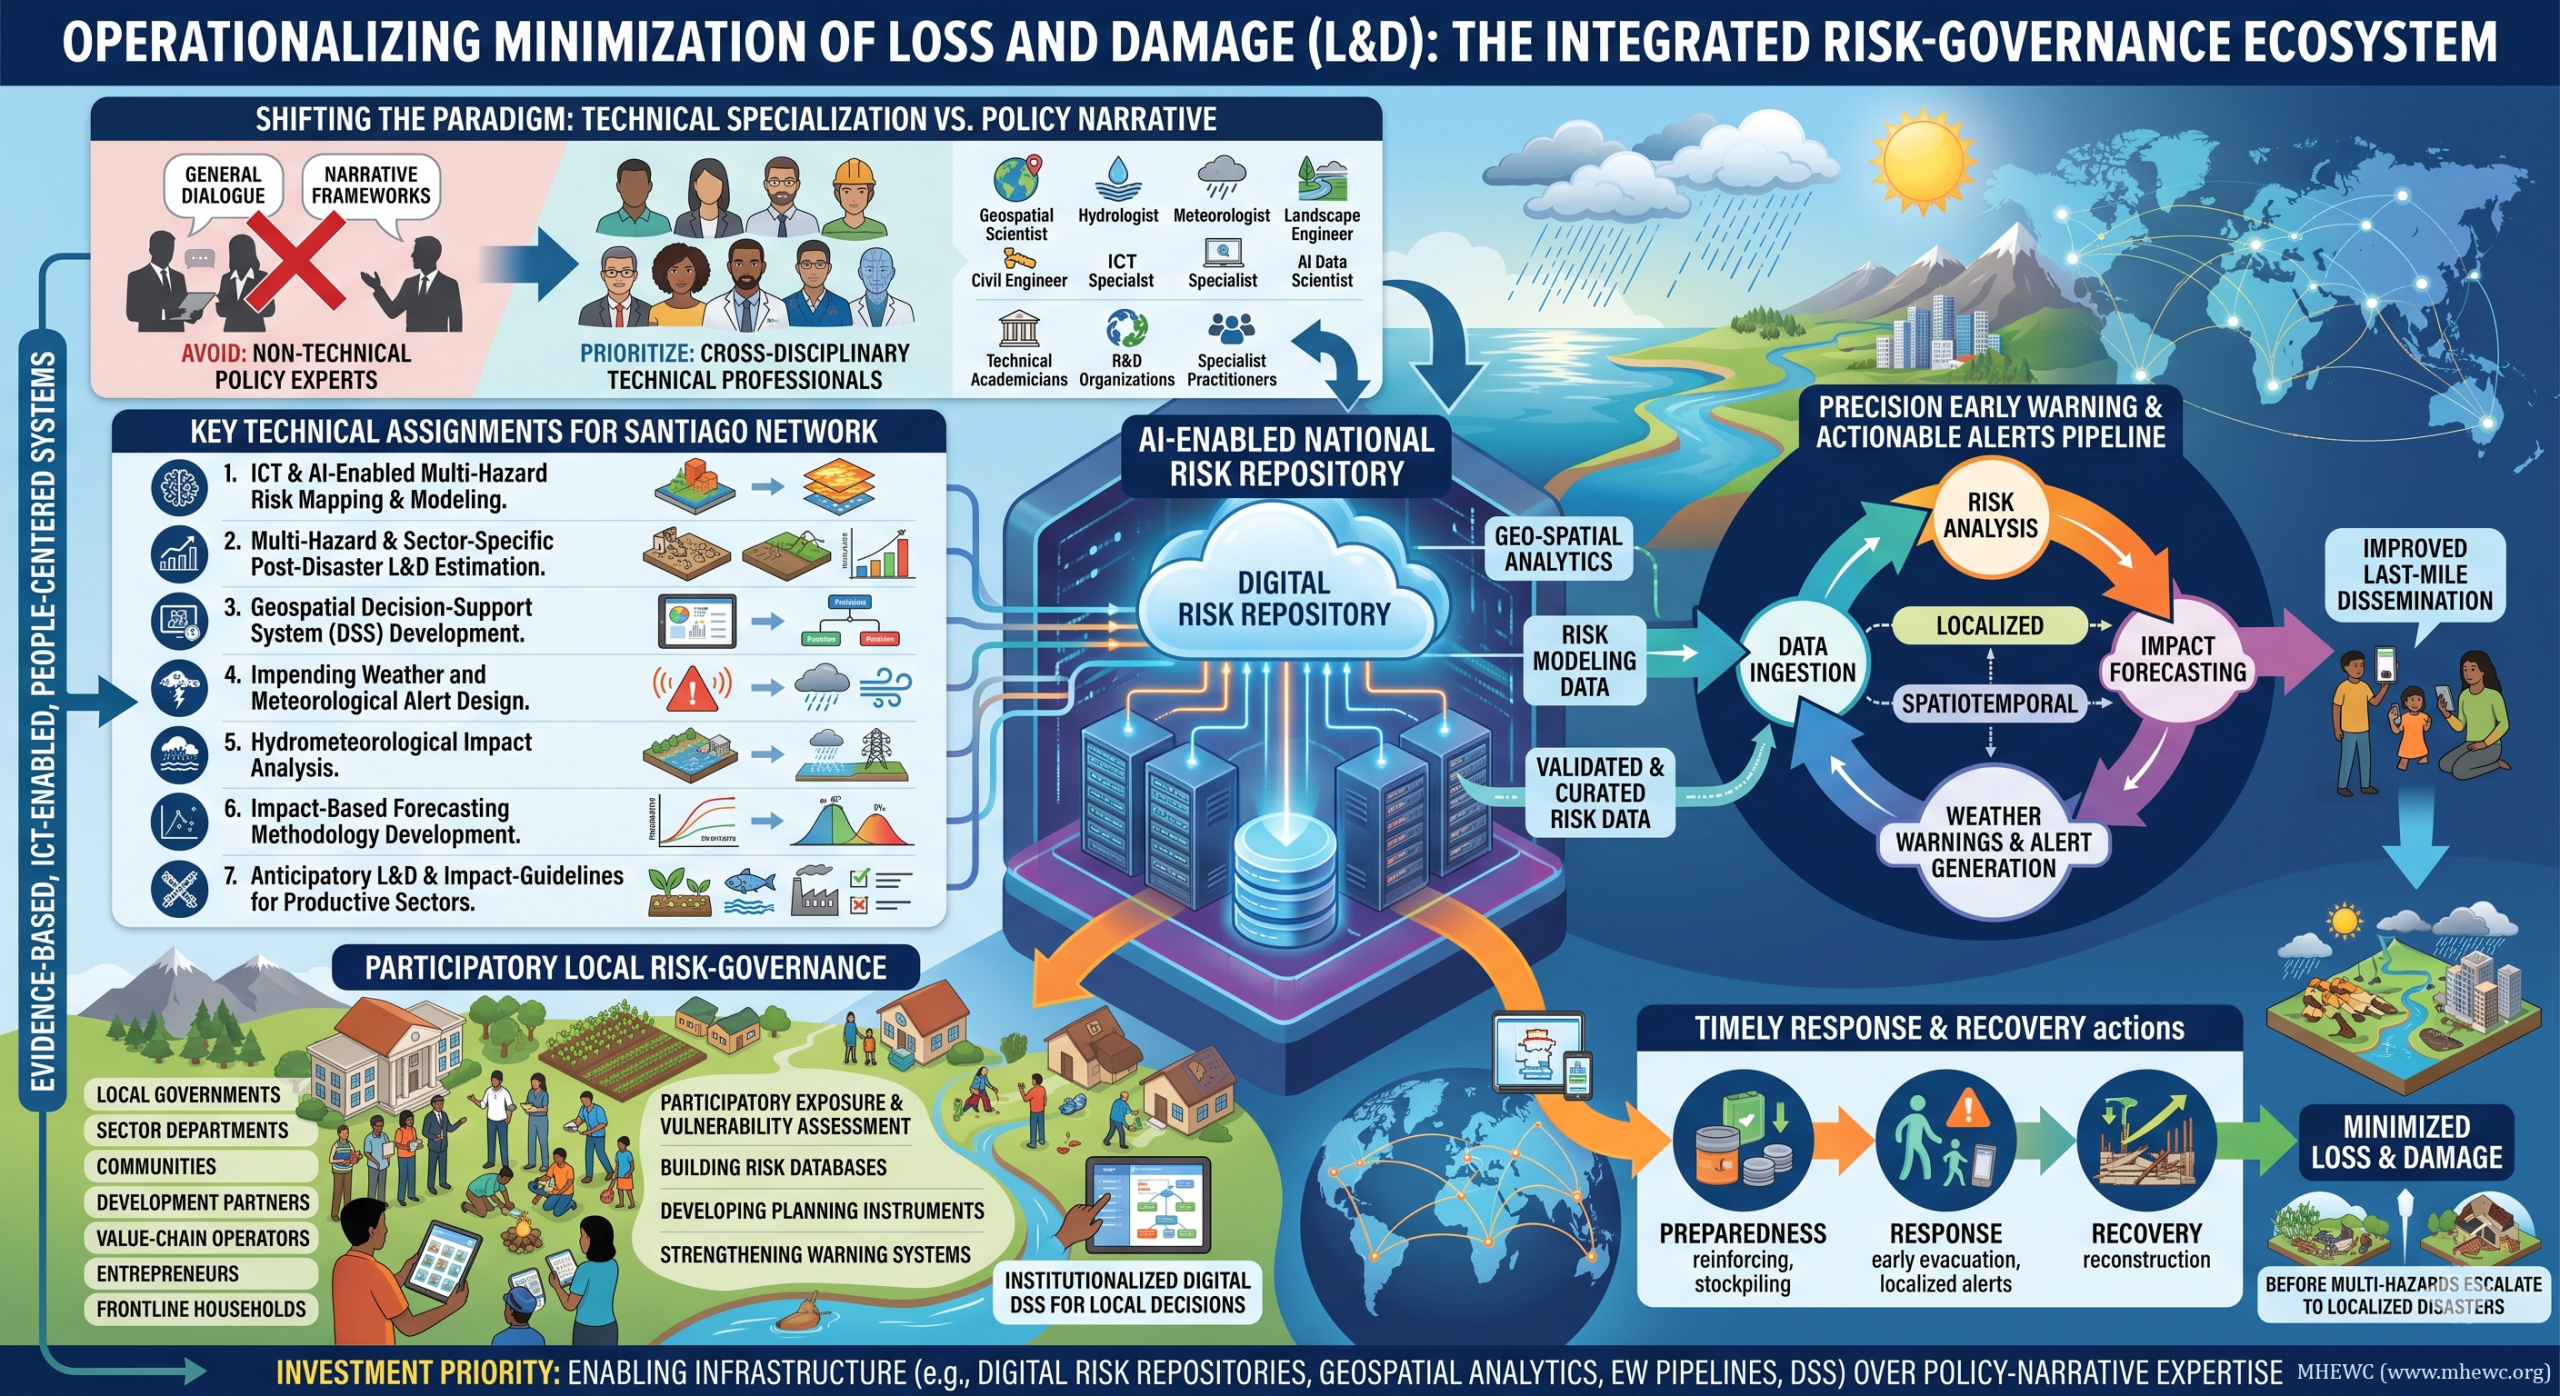
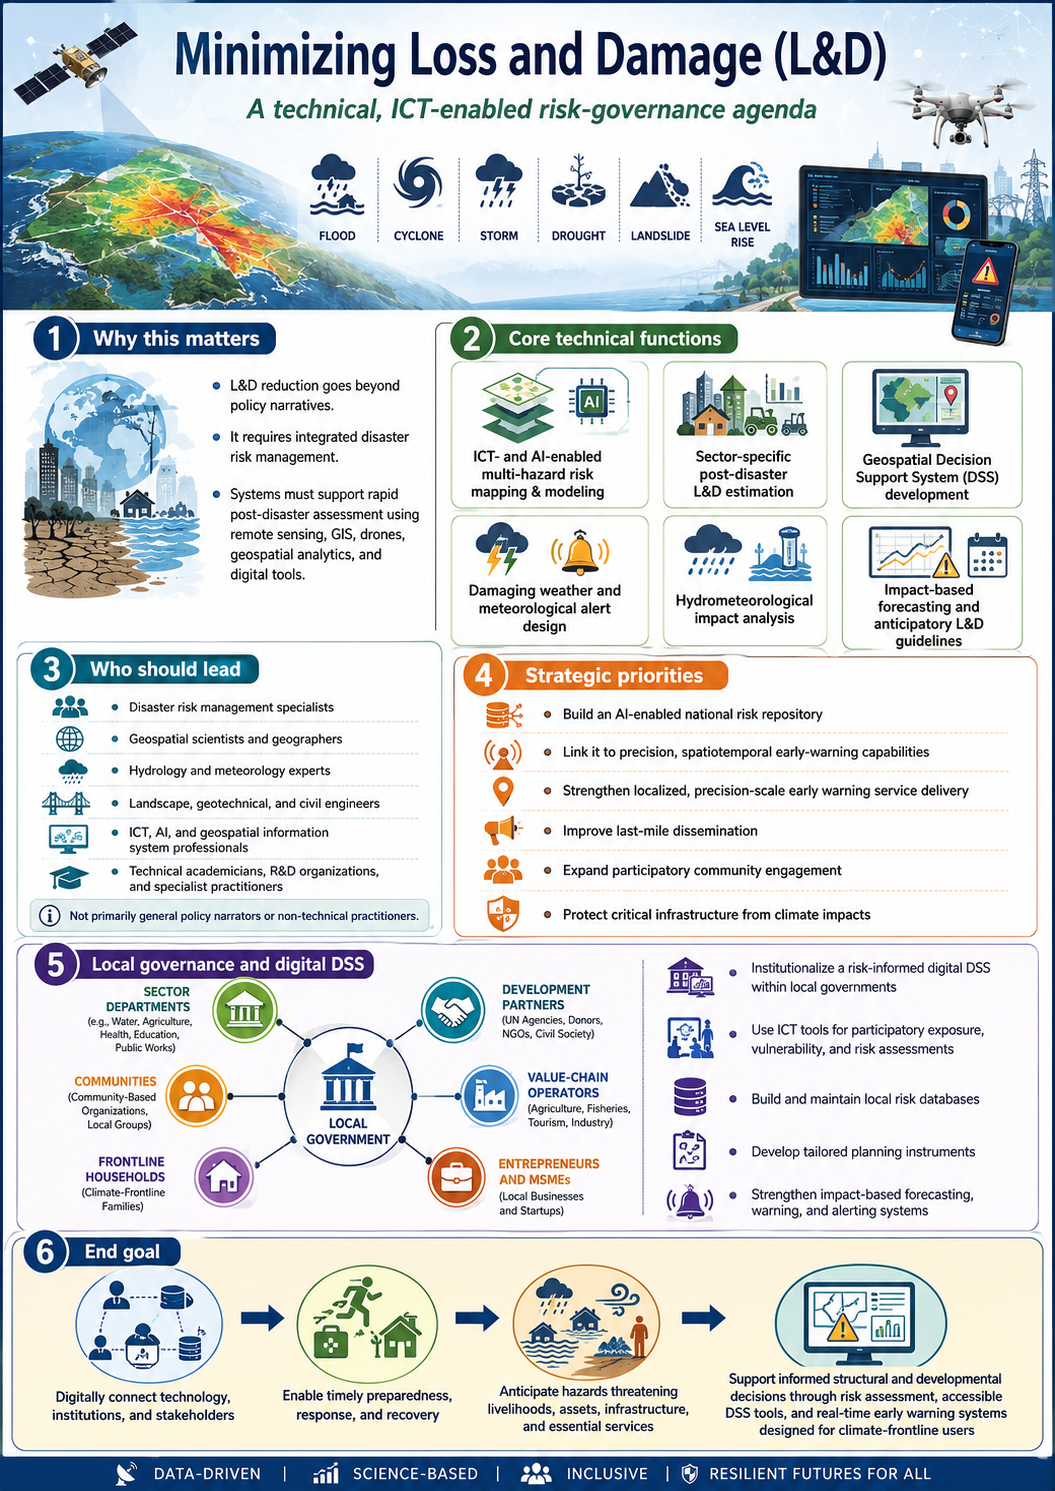
Minimizing Loss and Damage (L&D) is a complex risk-governance challenge that extends far beyond policy narratives. It requires an integrated disaster risk management approach supported by landscape, geotechnical, structural, infrastructural, hydrometeorological, geomorphological, and ICT-driven risk-governance systems. Such systems must be capable of generating rapid post-disaster L&D assessments using remote sensing, GIS, drones, geospatial analytics, and other digital tools.
Accordingly, strong guidance should be issued to the Santiago Network on Loss and Damage to ensure that relevant technical assignments are entrusted to qualified specialists. These tasks should include ICT- and AI-enabled multi-hazard risk mapping and modeling; multi-hazard and sector-specific post-disaster L&D estimation; geospatial decision-support system (DSS) development; impending damaging weather and meteorological alert design; hydrometeorological impact analysis; impact-based forecasting methodology development; and anticipatory L&D and impact-guideline preparation for climate-sensitive and climate-vulnerable productive sectors.
These functions should not be led primarily by general policy experts, policy narrators, bureaucrats, or development practitioners without the required technical specialization. They require professionals with cross-disciplinary expertise in disaster risk management, geospatial science, geography, hydrology and meteorology, landscape engineering, geotechnical engineering, civil engineering, ICT, AI-enabled data science, and geospatial information systems. Technical academicians, research and development organizations, and specialist practitioners with demonstrated experience in risk assessment, risk-repository development, risk modeling, element-specific risk analysis, impact estimation, and L&D calculation should be prioritized.
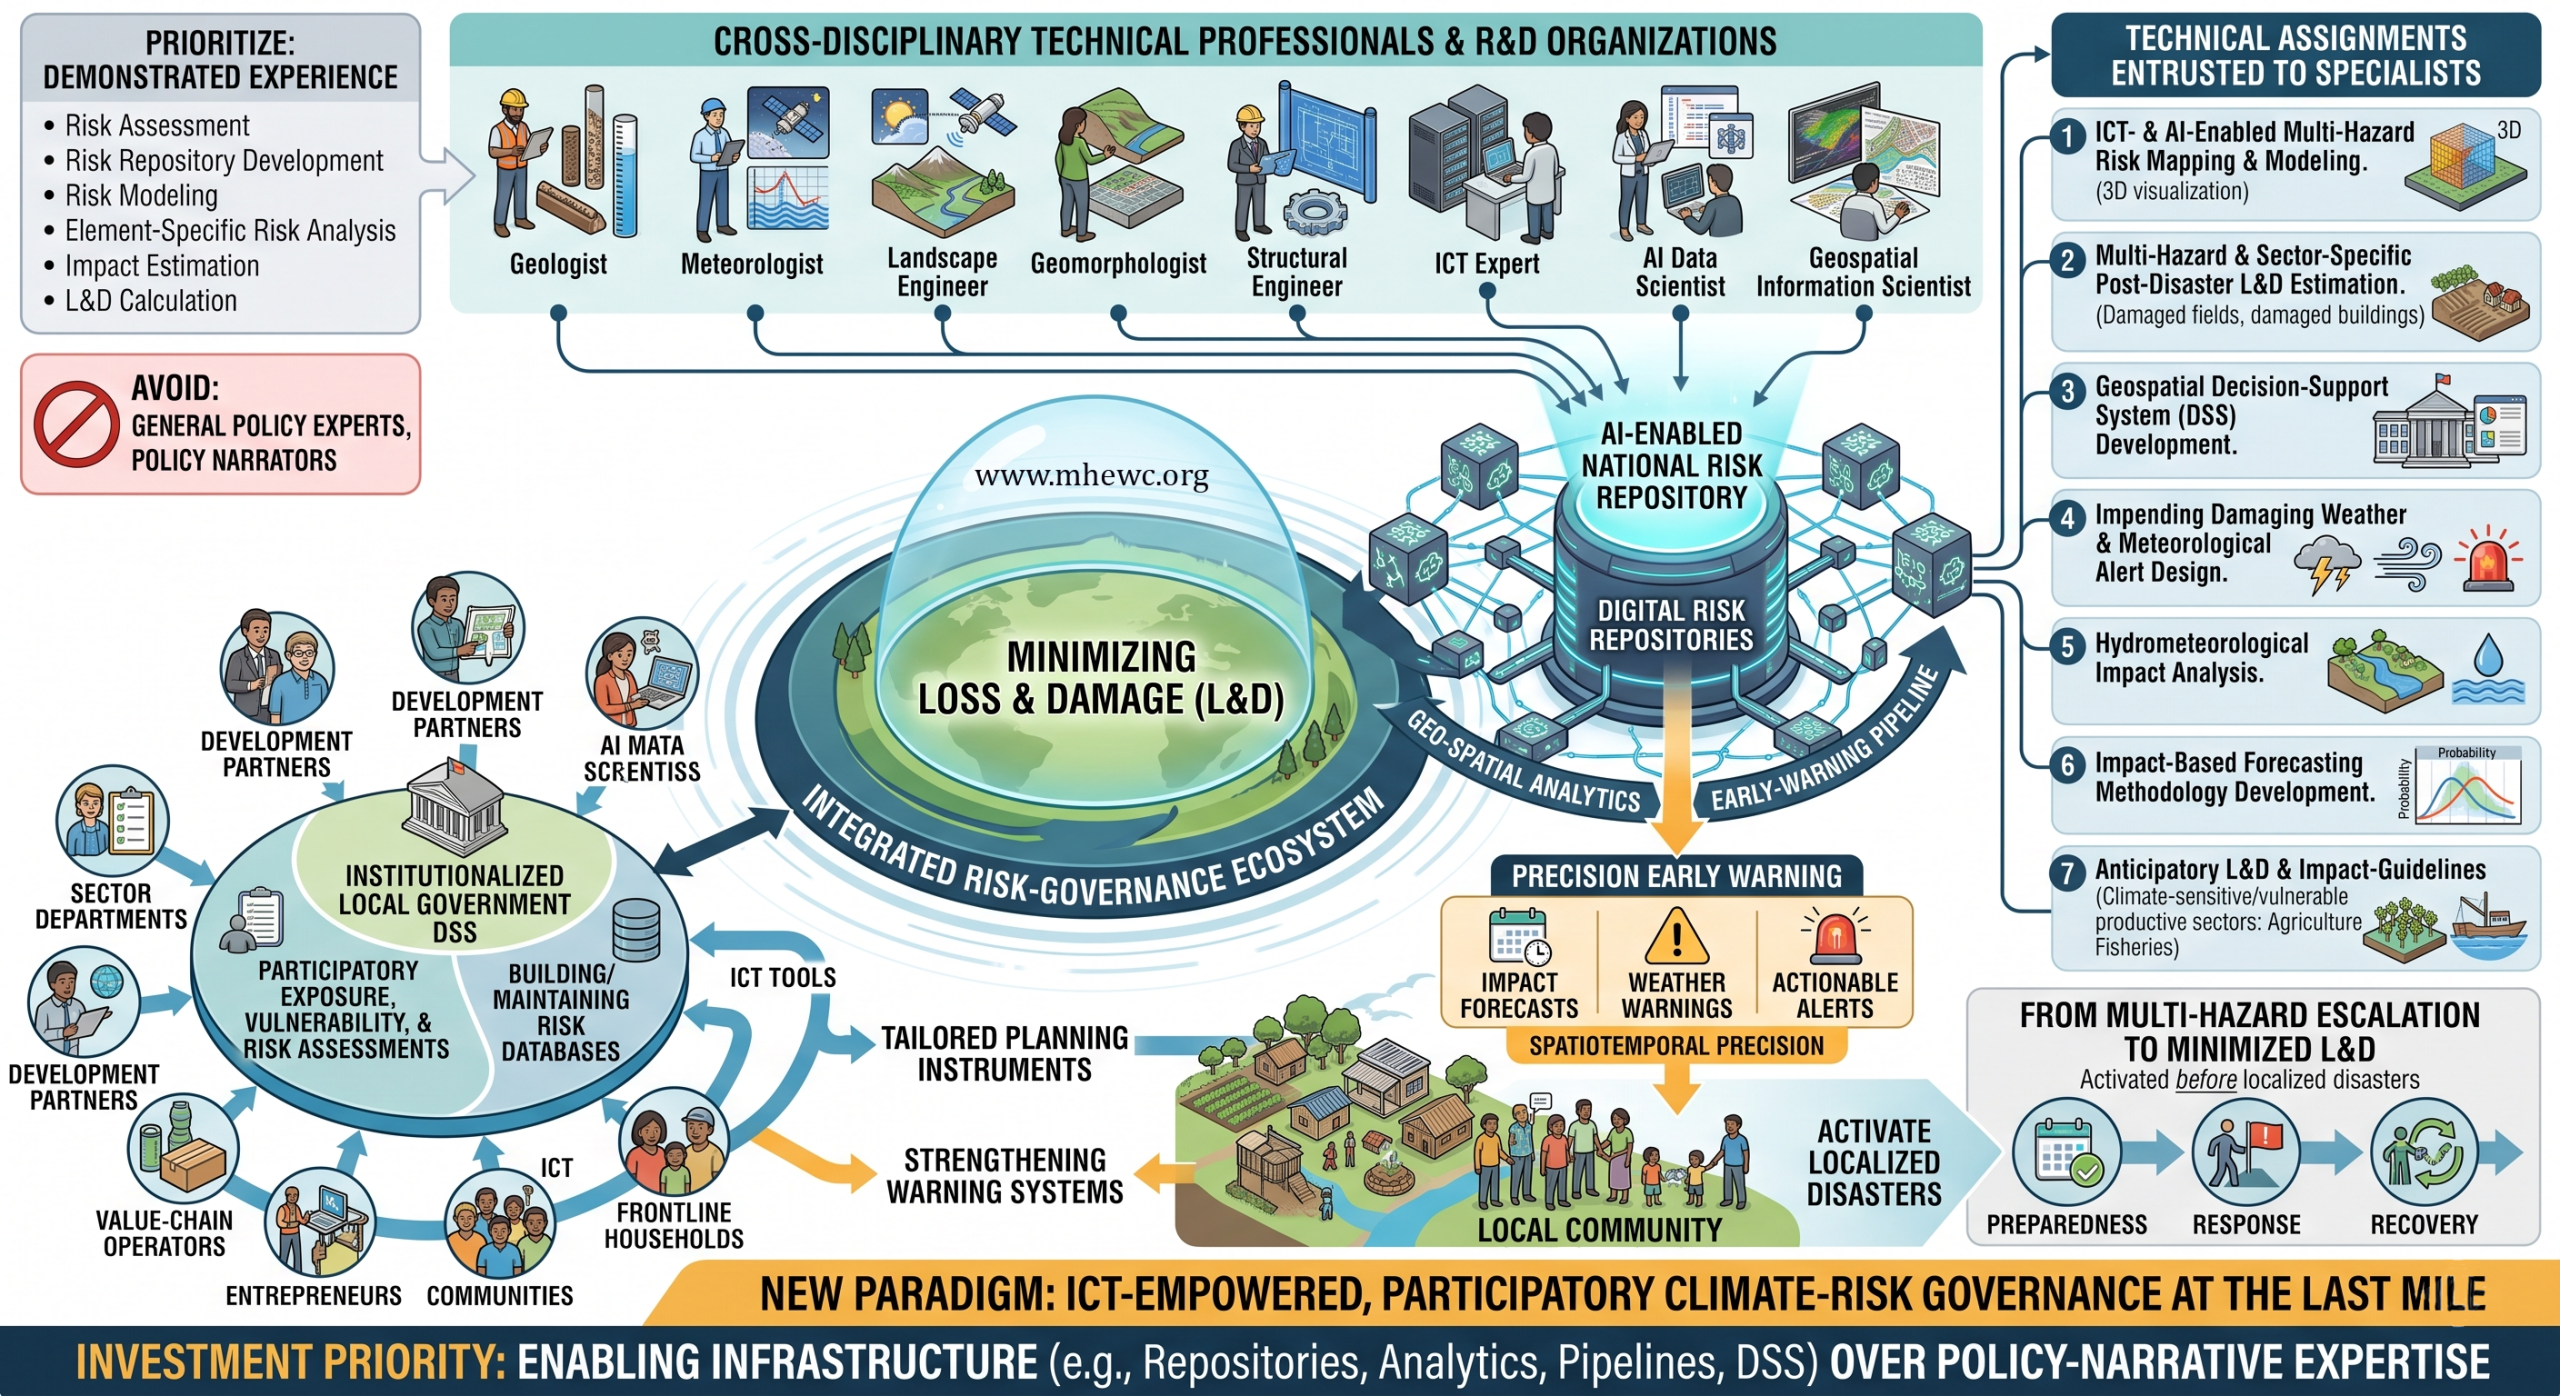
As multi-hazards become more rapid-onset, intense, and frequent, many countries still lack robust ICT- and AI-enabled risk-governance systems capable of serving productive sectors and climate-frontline communities. Reducing L&D therefore requires closing structural and infrastructure investment gaps through an ICT-informed governance model anchored in an AI-enabled national risk repository. This repository should be connected to precision, spatiotemporal early-warning capabilities, including impact forecasts, weather warnings, and actionable alerts.
Priority efforts should focus on strengthening institutionalized, localized, and precision-scale early warning service delivery; improving last-mile dissemination; expanding participatory community engagement in resilience-building; and protecting critical infrastructure from climate impacts. Effective risk governance depends on evidence-based, ICT-enabled, and people-centered systems supported by sustained political commitment and bureaucratic accountability. This includes transparent decision-making, accountable service delivery, efficient resource allocation, and stronger local government performance to safeguard frontline resilience.
Achieving this transformation requires a pool of experts and specialists working through an integrated, open-ended platform that advances a new paradigm of ICT-empowered, participatory climate-risk governance at the last mile. Investment should prioritize enabling infrastructure, including digital risk repositories, geospatial analytics, early-warning pipelines, and operational decision-support tools, rather than assigning policy-narrative expertise to technical roles for which it is not designed.
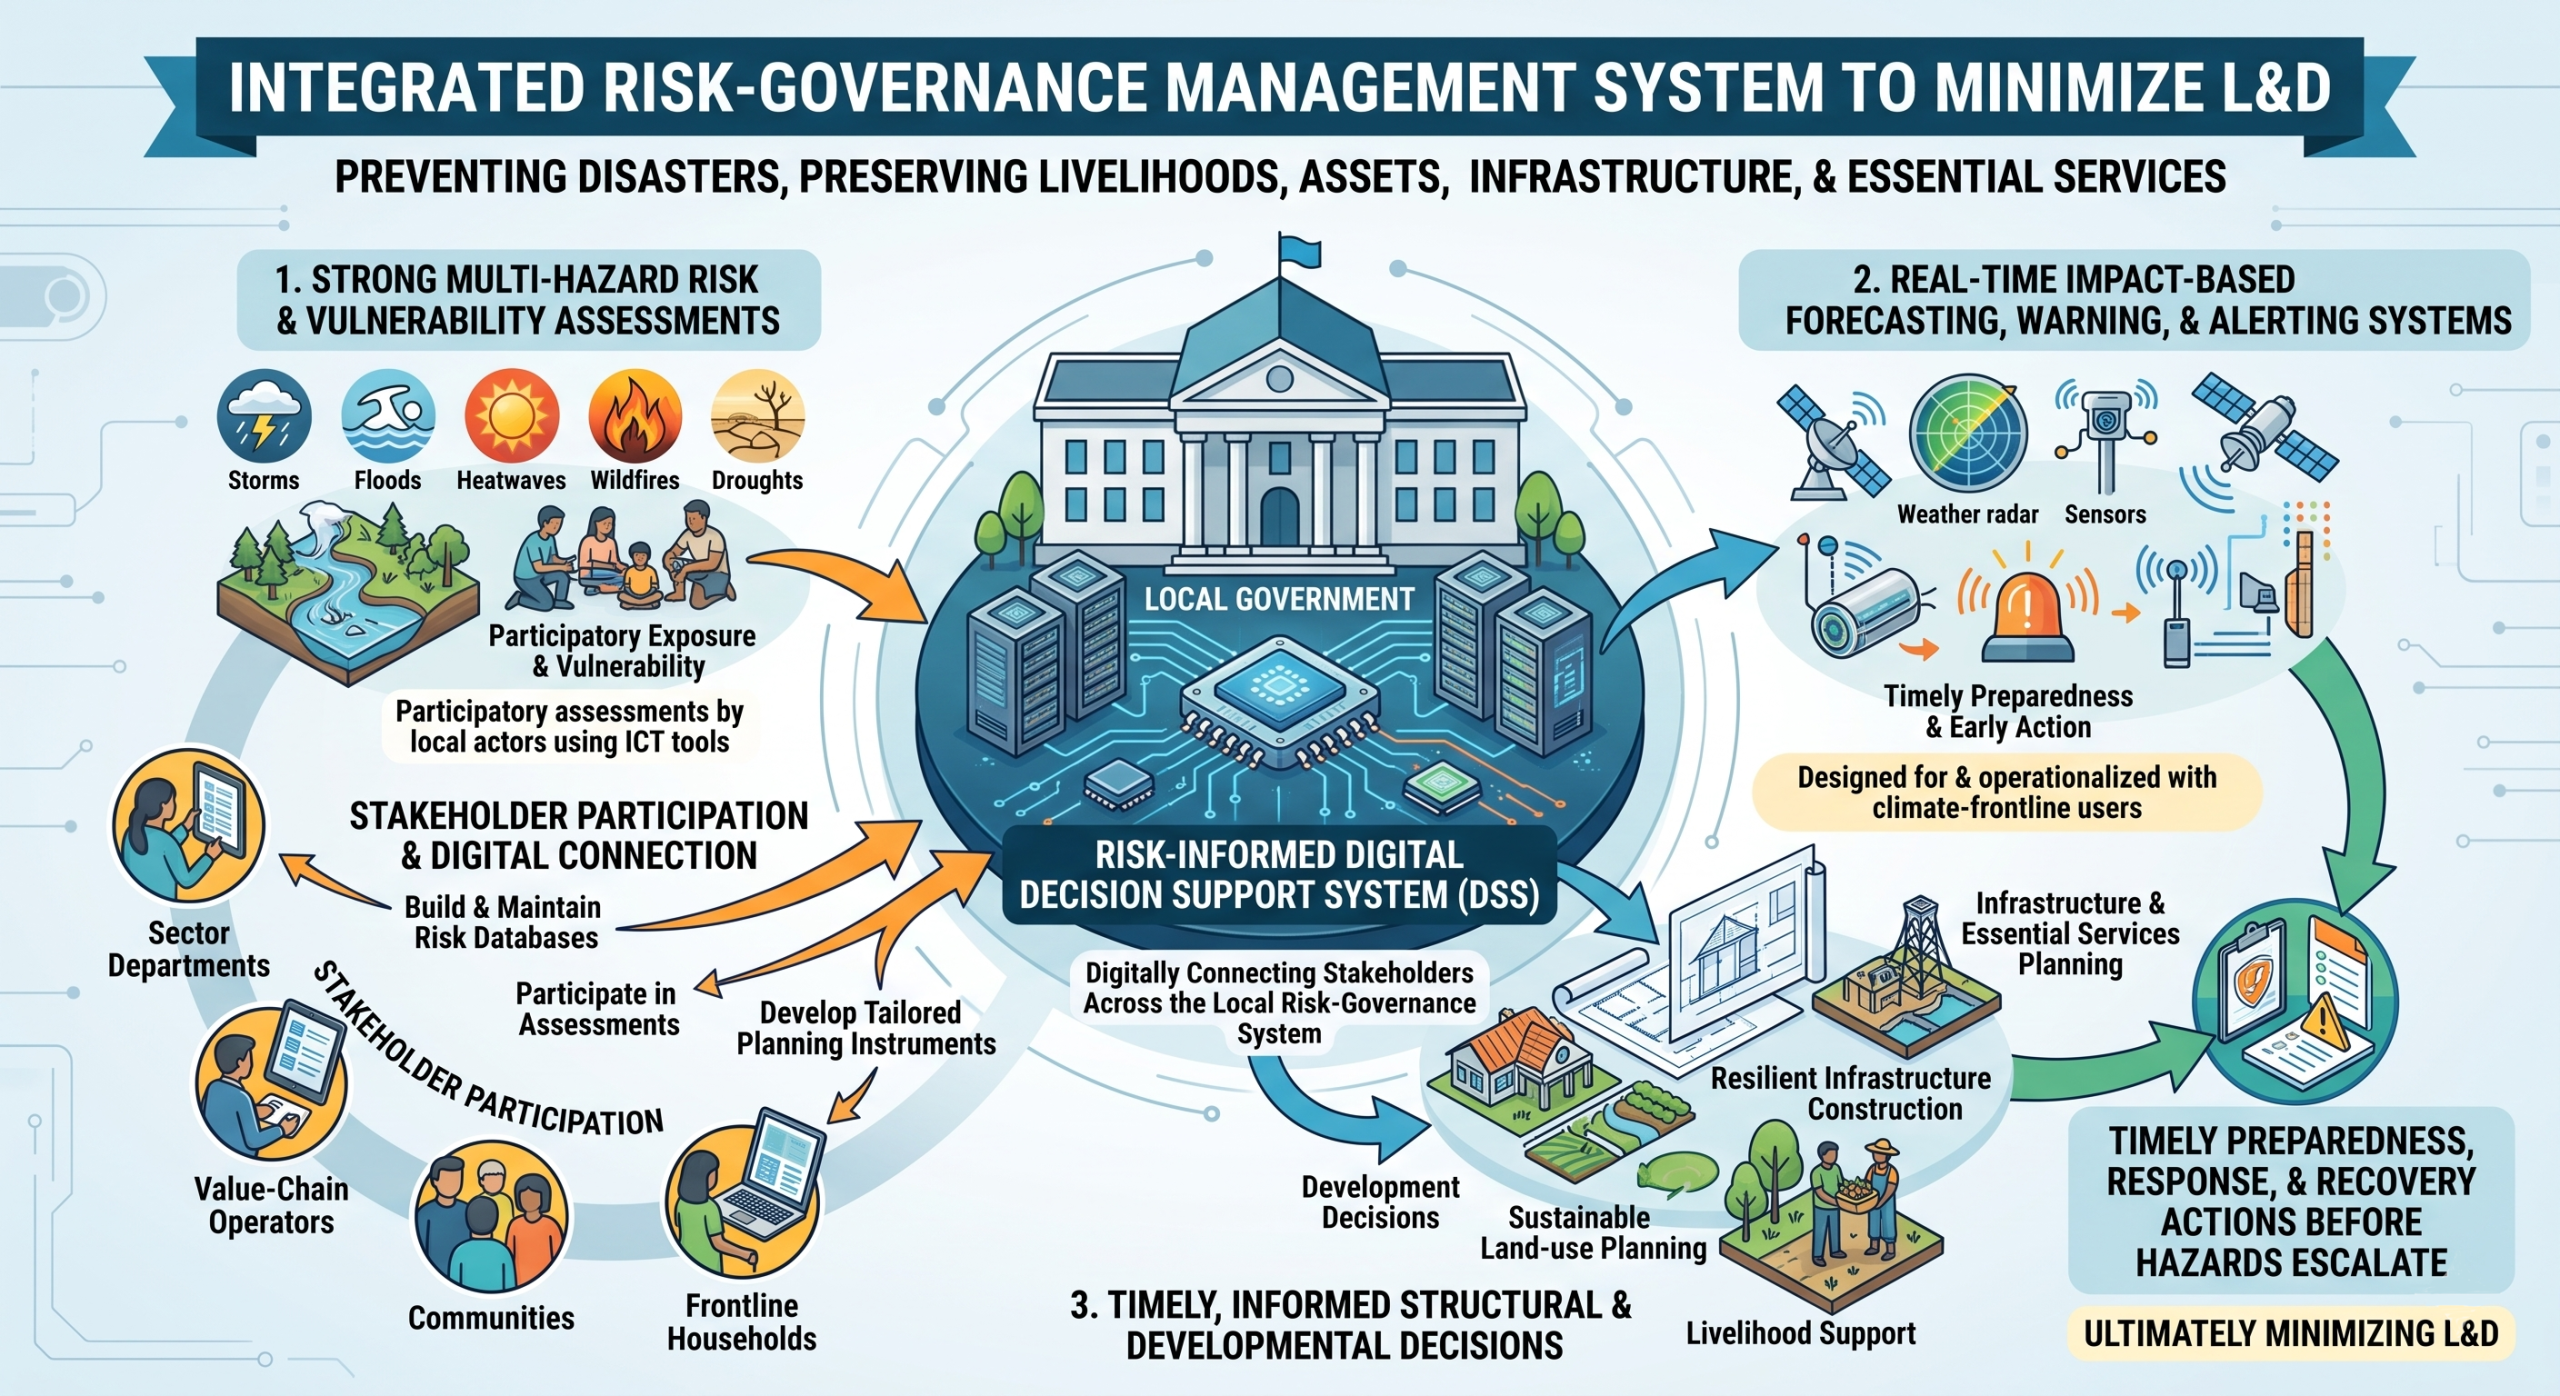
A risk-informed digital Decision Support System should be institutionalized within local governments and used to digitally connect stakeholders across the local risk-governance system. Local-level actors, including sector departments, development partners, value-chain operators, entrepreneurs, communities, and frontline households, should play central roles in participatory exposure, vulnerability, and risk assessments using ICT tools. They should also contribute to building and maintaining risk databases, developing tailored planning instruments, and strengthening impact-based forecasting, warning, and alerting systems.
Ultimately, minimizing L&D requires an integrated risk-governance management system in which technology, institutions, and stakeholders are digitally connected to enable timely preparedness, response, and recovery actions before multi-hazards escalate into localized disasters. It is fundamentally about anticipating hazards that threaten livelihoods, assets, infrastructure, and essential services, and making timely, informed structural and developmental decisions through strong multi-hazard risk and vulnerability assessments, accessible decision-support tools, and real-time early warning systems designed for, and operationalized with, climate-frontline users.
…………………………………………………………………………………………………………………………………………………
Sample Documents………
Download
Download – Evidence-based Identification and Spatiotemporal Assessment of the Loss and Damage(L&Ds) in Satkhira and Kurigram districts of Bangladesh
Download – in Word Document
1.0 Introduction:
Overview of Assignment :
Satkhira and Kurigram districts are significantly affected by persistent and recurrent climate risks and vulnerabilities. Satkhira, located along the edge of the Bay of Bengal, is exposed to multiple coastal hazards, while Kurigram, in northern Bangladesh, is highly susceptible to riverine flooding at the onset of the monsoon, driven by the Brahmaputra River system and upstream flows from the Tibetan Plateau. This study aims to promote geospatial-technology-based tools for assessing loss and damage resulting from both seasonal and recurring hydrometeorological hazards, as well as persistent climate-related exposure and vulnerability.
Objective of the assignment:
The primary objective of this assignment is to devise and operationalize appropriate loss-and-damage (L&D) assessment tools for the selected study area. This includes: (i) acquiring data from both primary and secondary sources; (ii) establishing effective data collation and validation techniques; and (iii) applying geospatial-technology-based spatial analytics to quantify disaster impacts at the highest feasible resolution across key sectoral elements affected (i.e., assets and services that are lost and/or damaged).
The assignment will also outline systematic steps and procedures for assessing the post-disaster L&D context following an event. Given the geographical characteristics of the study locations, the proposed scientific methodology will focus on two hazard events—riverine flooding and storm-related impacts—to analyze and quantify L&D outcomes.
Due to time constraints, the study area has been narrowed to two highly vulnerable unions—one in Kurigram and one in Satkhira. Reflecting their geographic settings, Satkhira represents a frontline of coastal vulnerability and is exposed to multiple coastal hazards, while Kurigram in northern Bangladesh experiences severe riverine flooding during the early monsoon period.
If you share the names of the two unions and the sectors you are prioritizing (e.g., housing, agriculture, WASH, roads, livelihoods), I can further tailor this into a ToR-ready objective with sub-objectives and expected outputs
2.0 Assessment Approach
2.1 Identify the structural gaps of the Government Cyclone disaster declaration process :
Satkhira District is among the most climate-vulnerable locations globally due to its proximity to the Bay of Bengal and its flat, low-lying, highly fragmented coastal landscape. These characteristics make the district acutely exposed to coastal hazards, particularly cyclone-driven storm surge and saline intrusion. When a high-intensity cyclone makes landfall in or near Satkhira, the impacts can be severe: extensive damage to fragile coastal settlements and productive land, degradation of the Sundarbans, the world’s largest mangrove forest, and widespread inundation by saline water. Such storm-surge-driven salinity can cause significant losses to biodiversity, crops, and other livelihood assets and services.
Despite these risks, the existing cyclone early warning and response arrangements remain constrained by limited spatial and temporal precision. Current systems are often insufficiently “precision-guided” to indicate, with adequate lead time and geographic specificity, which coastal unions and settlements are most likely to experience landfall-adjacent impacts and the highest surge depths. In parallel, even when cyclones make landfall along the Bangladeshi coast, the formal government disaster declaration process can be delayed. These combined weaknesses, early-warning limitations, and delays in disaster declaration create multiple points of failure that can amplify losses and damage.
Accordingly, the assessment should identify and document critical failure points within Bangladesh’s disaster declaration roadmap, drawing on evidence from recent large-scale cyclone and fluvial flood events and aligning with established post-disaster assessment processes led by the Needs Assessment Working Group (NAWG).
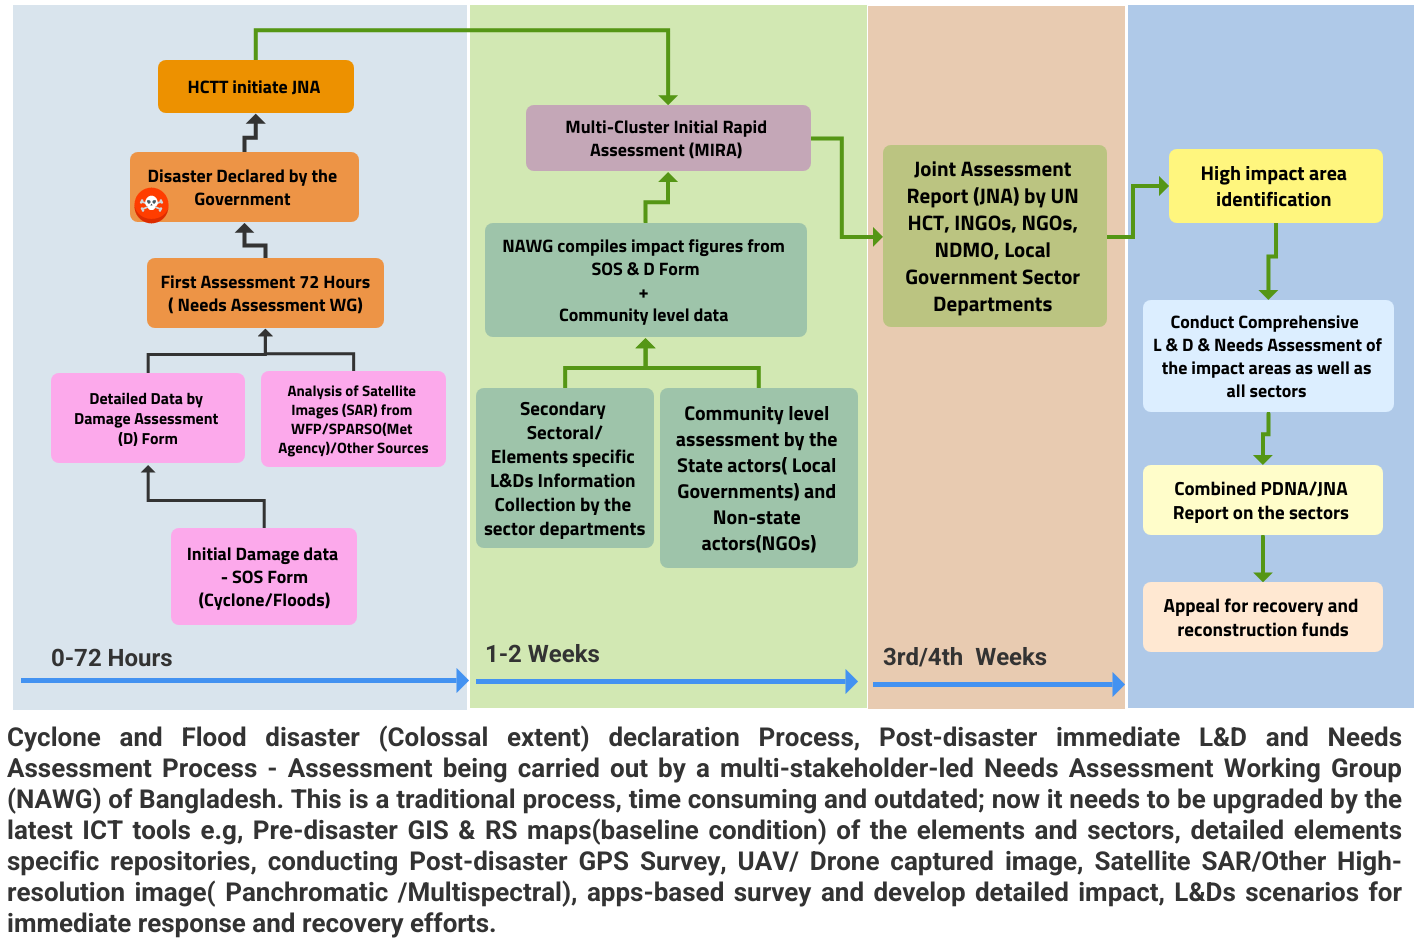
Figure: Cyclone disaster declaration process
The assessment should examine the real-time, data-driven cyclone-tracking and early-warning system currently in place, with a focus on its ability to generate timely, location-specific guidance that supports early action planning. This includes assessing how effectively the system can identify likely cyclone track corridors, probable landfall epicenters, and delineated buffer areas where destructive impacts, such as the anticipated trail of destruction, losses, and damages (L&D) to key elements, and other high-impact events are most likely to occur.
2.2 Assessment Preparation:
At the preliminary stage, the scoping of the assessment L&D aftermath disaster normally depends on the acquisition of overall impacts of the disaster, including the landfall from the JNA, to identify the high-impact areas, impact level, and other sectoral first-hand impressions of impacts trailed by the disaster.
- Analyzing the datasets ( Geospatial and statistical ), a scientific approach is being proposed for the
- Procedure for L&D of selected Unions of Kurigram and Satkhikhra, considering the past severe disaster.
2.3 Desk review
2.3.1 Desk Review and Data Acquisition Tasks
Review secondary datasets (ASD and poverty/demographics)
Compile and review available secondary data on age- and sex-disaggregated poverty, demographic profiles, and socioeconomic indicators from:
National statistical systems and official publications
Local Government Institutions (LGIs)
Relevant sector departments (e.g., agriculture, health, water, disaster management)
Local stakeholders, development partners, and implementing actors
Review existing risk and vulnerability assessments
Collect and synthesize existing assessments on persistent and perennial climate/disaster risks and vulnerabilities conducted for the study area, including hazard, exposure, vulnerability, and capacity analyses.
Acquire pre-disaster geospatial imagery and sector GIS layers
Acquire and curate pre-disaster high-resolution satellite imagery and complementary geospatial datasets, including:
Aerial photographs and drone imagery (where available)
Sector-produced GIS base maps
Spectral and thematic layers such as agricultural land-use/land-cover, cropping patterns, and crop calendars/maps
Review sectoral Information Management Systems (IMS) and local GIS inventories
Review sectoral IMS and geospatial databases covering local-level elements, including:
Physical and infrastructure assets (transport, power, public facilities)
Socioeconomic and livelihood assets
Built environment and housing typologies
Natural resources and ecosystems
Water resources and water infrastructure
Commercial and market infrastructure
Value chain assets and operating elements (inputs, production, storage, transport, processing, trading)
Map local economic functionaries and value-chain operating elements
Identify and geolocate key economic actors and functional nodes, including:
Cooperatives, integrated farms, and smallholder farms
Value-chain operators and service providers
Critical “service trigger points” (e.g., aggregation centers, markets, cold storage, transport hubs)
Local economic performance indicators and operational dependencies relevant to disruption and recovery
2.3.2 Preliminary tools preparations:
Preparation/Customize GIS Maps:
Preparation and Customization of GIS Maps
- Core base layers and administrative framework
| Dataset / Map Product | Source | Layer type | Mapping purpose | Primary uses / outputs | Tools |
| Administrative boundary & plot boundary map (Mouza, Ward, Union) | DLRS / SoB (as available) | Polygon | Establish authoritative administrative and plot framework | Plotting all elements; Union/Mouza-level reporting; pre-crisis baseline | QGIS / ArcGIS Pro; PostGIS |
| Detailed Union/Upazila basemap (customized LGED basemap) | LGED + local verification | Mixed (polygon/line/point) | Create a complete “Local Government basemap” for CRVA and L&D | Insert missing elements; standardize IDs/attributes; prepare analysis-ready base | QGIS / ArcGIS Pro |
| Roads and connectivity networks (updated) | LGED + OpenStreetMap + satellite verification | Line | Represent access routes, evacuation routes, market access | Exposure mapping; emergency response routing; accessibility analysis | QGIS; OSM extract tools |
| Settlement/build-up footprints (updated) | Google Earth / satellite + OSM | Polygon | Capture settlement clusters and built environment | Exposure of households/services; hotspot mapping | QGIS; manual digitization |
- Land cover / land use and imagery baselines
| Dataset / Map Product | Source | Layer type | Mapping purpose | Primary uses / outputs | Tools |
| Land cover map (baseline) | Sentinel / Landsat | Raster + classified polygons | Establish baseline LULC classes | Crop/vegetation baseline; change detection; L&D attribution | Google Earth Engine; ERDAS / ArcGIS Pro |
| Land use map (detailed sector lens) | Sentinel/Landsat + field validation + secondary sources | Polygon | Identify agriculture, aquaculture, settlements, wetlands, etc. | Identify elements at risk; exposure by land use class | QGIS / ArcGIS Pro; GEE |
| High-resolution village/mouza imagery (pre-crisis) | Aerial photo / drone / Google Earth | Raster | Visual validation and micro-level feature capture | Digitize critical features; spot verification; baseline archiving | Drone processing suite + QGIS |
- “Elements at risk” inventory layers (sectoral elements)
| Dataset / Map Product | Source | Layer type | Mapping purpose | Primary uses / outputs | Tools |
| All sectoral elements layer (master inventory) | CRVA field survey + GPS apps + KoboToolbox + sector lists | Point/Polygon | Create the definitive element inventory (200+ elements) | L&D calculation; sector-wise exposure; PDNA-ready tables | KoboToolbox; QGIS/ArcGIS; PostGIS |
| Basic service delivery infrastructure | Sector departments + LGIs + field verification | Point/Polygon | Map health, education, WASH, admin services | Damage quantification; service disruption analysis | QGIS/ArcGIS; GPS apps |
| Commercial installations & marketplaces | Local markets, value-chain actors, OSM + field survey | Point/Polygon | Map market nodes and economic assets | Value-chain L&D; recovery prioritization | QGIS; Kobo; PostGIS |
| Emergency shelters & safe points | Local DM committees + field survey | Point | Identify shelters, evacuation points, assembly areas | SOD 5W tasking; evacuation planning | QGIS/ArcGIS; dashboard |
- Multi-hazard exposure, incidence, and historical distribution maps
| Dataset / Map Product | Source | Layer type | Mapping purpose | Primary uses / outputs | Tools |
| Past disaster distribution maps (multi-year) | Govt/NAWG reports + local records + community timeline | Polygon/Point | Summarize historical high-impact events | Identify persistent hotspots; trend analysis | QGIS; PostGIS |
| Multi-hazard exposure maps (current) | Remote sensing + CRVA + secondary hazard layers | Raster/Polygon | Classify hazard footprints and intensity classes | Overlay with elements at risk; severity zoning | QGIS/ArcGIS; GEE |
| Persistent impact maps (e.g., waterlogging days, salinity) | Time-series RS products + field validation | Raster | Quantify chronic/persistent hazards | Economic loss modeling; “deterioration/accumulation” analysis | GEE; ArcGIS Spatial Analyst |
- Agriculture, fisheries, livestock, and value-chain thematic maps
| Dataset / Map Product | Source | Layer type | Mapping purpose | Primary uses / outputs | Tools |
| Agriculture mapping (arable land, crop distribution, seasonality) | DAE + RS classification + field survey | Polygon | Baseline crop and plot-level agricultural elements | Crop-stage impact analysis; yield-loss proxies | GEE; QGIS/ArcGIS |
| Specialized agriculture layers (tolerant varieties, floating agriculture, lead farmers, input suppliers, AVC nodes) | DAE/private sector + community mapping | Point/Polygon | Map adaptive practices and value-chain operators | Targeted recovery; resilience investments | Kobo; QGIS; PostGIS |
| Fisheries & aquaculture mapping (pond/gher/baor/beel/khal/canal/lake; rice-fish) | DoF + RS + field validation | Polygon | Identify aquaculture and open-water elements | Physical damage + economic loss; exposure profiling | QGIS/ArcGIS; GEE |
| Livestock / integrated farms / cooperatives | DLS + local lists + field survey | Point/Polygon | Identify livestock assets and integrated systems | Sector L&D; livelihoods recovery design | Kobo; QGIS |
- Utility and other service infrastructure maps (expandable list)
| Dataset / Map Product | Source | Layer type | Mapping purpose | Primary uses / outputs | Tools |
| Utility services (e.g., biogas plants, energy/WASH points, service hubs) | LGIs + sector departments + field survey | Point | Capture service assets and trigger points | Damage assessment; continuity planning | Kobo; QGIS/ArcGIS |
How these maps will be used for L&D calculations
- Build the pre-crisis baseline: administrative/plot layers + land cover/land use + element inventory.
- Generate hazard footprints and intensity: flood extent/duration, storm surge depth/extent, salinity classes, erosion-prone banks, persistent waterlogging days, etc.
- Overlay analysis: intersect hazard intensity layers with “elements at risk” layers to identify exposed/damaged elements and quantify by sector, Union, grid cell (e.g., 5 km × 5 km), and intensity class.
- Economic loss logic (especially for agriculture): incorporate variables such as:
- number of waterlogging days; flood duration
- crop growth stage (seedling/sapling/standing crop)
- crop sensitivity and tolerance thresholds (days/% withstand capacity)
- Outputs: L&D tables (sector-wise), maps, and infographics for anticipatory action, PDNA inputs, and recovery planning.
Minimum QA/QC and standardization requirements
- Common coordinate reference system (CRS) across all layers and consistent scale rules (Union/Mouza).
- Unique IDs for each element, with a standardized attribute schema (sector, subtype, ownership, replacement value, vulnerability class, etc.).
- Metadata for every layer: source, date, resolution, processing steps, confidence rating.
- Ground-truthing / spot checks for critical layers (settlement footprints, key infrastructure, crop/aquaculture classes).
| Dataset | Source | Layer | Mapping purpose | Uses |
| Prepare Plot boundary map (Mouza, Ward, Union) | DLRS/SOB | Plotting items over the map | Featuring most the elements over the map | Pre-crisis scenarios on hand |
| Land cover map | Sentinel image, Landsat imageExtracting from google earth.Aerial photograph image of village/mouza | Land use-based elements | Tools to identify the elements being impacted, lost, or damaged | Customize the typical GIS Base map developed by LGED with re-adjustment and inserting the missing elements from the Google Earth image, OpenStreetMap map, and latest satellite images.Extracting elements specific polygon layer/point features from open street maps with QGIS • Detailed Administrative base map of the study area: Prepare plot boundary • Prepare detailed land cover and land-use maps (latest satellite image, and other secondary sources) |
| Prepare Detailed Union/Upazila Base map | Land use map showing elements of agriculture, crops (standing, newly planted) , fisheries ( pond, ger, case, lake, khal, beel ) , water bodies ( open, reserve, freshwater ), agroforestry, settlements, commercial installations, small holder farm lands, etc. | Tools to identify the elements being impacted, lost, or damaged | Prepare a Detailed Union/Upazila Base map | All sectoral elements on the map |
| Prepare multi-hazard and disaster incidence maps of the area. Prepare multi-hazard/disaster distribution maps summarizing the past few years of disasters and multi-hazard events that occurred over the areas. | Prepare a land use map | Existing land-based elements | Plotting the land component over the map | Tools to identify the agroecological resources being impacted, lost, and damaged |
| Past disaster distribution map | Showing high-impact disasters/multi-hazards of history | Common multi-hazard maps of the area | Determine the persistent impacts on the map | Overlaying disaster impact maps over the elements and determine the damage level.Calculate the economic loss by analyzing the variables of magnitude of disasters ( no of water logging days ), type and duration of the growth of standing crops/seedling /sapling , sensitivity and no of days/% of crops crop can withstand etc. |
| Agriculture mapping | Showing arable lands, crop distribution of the cropping season, round-the-year vegetable/fruits production, Agri-plots on saline tolerant varieties, flood tolerant variety cropping. Location of Lead farmers, marginal farmers, AVC operators, input suppliers, DAE/Private horticulture, commercial seedling/sapling producers., IFM, IPM, INM, FYM stack layer farming, floating agriculture | Agricultural elements | Showing elements over map existing (pre-disaster) | Overlaying disaster impact maps over the elements and determine the damage level. Calculate the economic loss by analyzing the variables of magnitude of disasters ( no of water logging days ), type and duration of the growth of standing crops/seedling /sapling , sensitivity and no of days/% of crops crop can withstand etc. |
| Fisheries and livestock mapping | Fish pond, ger, open waterbody, case culture areas, beel, canal, khal, lake, aquaculture land ( paddy & fish culture ) , integrated farms etc. | Fish ponds | Showing elements over map existing (pre-disaster) | Determine the physical damage and economic loss of the elements overlapping the disaster impacts over map |
| Prepare maps on other utility services | Biogas plants, |
- Synergy settings pre- & post disaster impacts :
| Tools | Process | Purpose/usability |
| Climate sensitive cropping calendar, sectoral elements calendrer e.g. WASH, water supply, freshwater, surface sweet water ( Satkhira) | Analysis post-disaster impact scenarios with crop-agriculture elements being impacted | Comparing pre-crisis scenarios with post disaster/high-impact scenarios and identify outcome of impact scenarios |
| Multi-hazard/disaster calendar of the area | Desk review and Analysis of historical similar disaster and multi-hazards with magnitudes and impact level comparing with the current situation | Comparing previous/historical L & D facts/figures with prevailing impact scenarios. |
| Occupational /economic activity/ business / value chain operations, input supply, operational market /growth center/ livelihood( vulnerable group ) calendar | Conducting FGD/KII | Comparing pre-crisis scenarios with post disaster/high-impact scenarios and identify outcome of impact scenarios |
- Preparation maps/tools from secondary data sources: Secondary data analysis :
| Datatype | Database | Maps | Source | Purpose of uses | |
| BBS HIES datasets Socio-economic (Poverty data, VGD/VGF datasets from Union Parishad, relevant assessment studies being undertaken | Local of vulnerable pockets on livelihood class | Oxfam Local | Identify the pocket of persistent social economic volubility | ||
| Age-sex disaggregated data | Identify the most vulnerable group to higher category of cycle/storm surges and severe flooding | ||||
| Value chain operators | Identify pre-disaster number of value chain operators were functional. Summarizing functional economic value/liquidity while operational in pre-disaster conditions. | ||||
| In consultation with DAE officials, Lead farmers, marginal farmers, AVC operators, input suppliers, DAE/Private horticulture, commercial seedling/sapling producers identify the following factors affecting crops-agriculture. |
2.4 Data collection method:
- Statistical and attribute data collection:
| Data source/Type | Data category | Usability | |
| JNA report | initial assessment, datasets, facts and figure of the impact assessment being conducted by NAWG/ Sectors | Scoping and selection of study area | |
| Collection, collation of baseline datasets from secondary sources ( sectors, BBS, Local government institutions & sectors), DRR, CCA livelihood, food security and other development-related projects being implemented/under implementation over the study area | Statistical data ( HIES) Age, sex disaggregated data income poverty, VGD, VGF etc.Socioeconomic aggregated/disaggregated datasets from BBS, sector department | ||
| Primary data[1] from the study area with structure questionnaire on the sectors and elements (Physical infrastructure, socioeconomical infrastructure ,, commercial/value chain/financial, Environmental/agroecology, WASH, social/livelihood resource, financial, other basic infrastructure/structures, utility service delivery ) Conduct PRA process with affected community/households (transact-walk, household survey, FGD, KII) | Primary data[1] from the study area with structure questionnaire on the sectors and elements (Physical infrastructure, socioeconomical infrastructure,, commercial/value chain/financial, Environmental/agroecology, WASH, social/livelihood resource, financial, other basic infrastructure/structures, utility service delivery ) Conduct PRA process with affected community/households (transact-walk, household survey, FGD, KII) |
2.3.5 Geospatial data collection :
- Satellite data: Latest satellite…………….._ of affected areas for impact analysis
- Drone/UAV captured image ( aerial photo, multispectral and panchromatic image ) for impact analysis
3.0 Conduct consultation[2] :
| Mode of consultation | Target audience | Expected outcome |
| Organize consultation with Union/Upazila Parishad | the sharing of baseline information, impact level of the study area | Taking inputs/impression on impact level, number of elements are impacted, lost, initial damage scenarios, gross economic loss of the sectoral elements |
| Organize meeting/KII with | Technical Working Group (TWG)/member of the Union Disaster Management Committee (UDMC), Ward Level Disaster Management Committee, Village level disaster management committee (VDMC) NGOs, COS, CBO, BDCRS, social group, charities, clubs, emergency shelter group, emergency response, rescue & recovery group, and other social groups Emergency lifesaving services proving group Meeting with Upazila sector departments FGD/KII with occupational group, WASH, local SMEs, business entity, | As above |
4.0 Methodology and Approaches of Loss and Damage Estimation
4.1 Prepare CRVA tools:
4.1 Prepare CRVA Tools
Develop GIS-based administrative boundary maps for Local Government units to serve as the core spatial framework for the Climate Risk and Vulnerability Assessment (CRVA). All administrative-layer basemaps will be customized and enriched by integrating essential geospatial features across the landscape, including but not limited to:
- Physical infrastructure: roads, bridges, embankments, culverts, public facilities
- Communication and connectivity networks: road hierarchy, key routes, mobile/network service points (as available)
- Land use / land cover: agricultural land classification, built-up areas, vegetation, wetlands
- Built environment: settlement footprints, housing clusters, critical structures
- Basic service delivery infrastructure: health facilities, schools, WASH infrastructure, administrative offices
- Water resources: rivers, canals, ponds, wetlands, drainage networks, water bodies
- Socioeconomic and commercial infrastructure: markets, commercial installations, storage facilities, value-chain nodes
- Natural and environmental resources: forest/mangrove elements (where applicable), ecologically sensitive zones
- Emergency preparedness and response assets: cyclone/flood shelters, evacuation routes, safe points
- Service trigger points: key functional nodes that activate/enable services during normal operations and emergencies
These layers will be compiled and validated using a combination of remote sensing and Earth observation sources (including Google Earth Engine-derived products), high-resolution satellite imagery, and drone-captured imagery where available, supplemented by sectoral GIS datasets and local verification.
The final output will be a comprehensive, multi-layer GIS basemap designed to support household- and community-level mapping of climate and multi-hazard exposure, risks, and vulnerabilities, enabling high-resolution CRVA analysis and decision-ready visualization.
i) Robust Design of L & L&D Assessment Tools, Methodology, Guidelines, and Conducting the L & D Assessment works :
The assignment will develop and operationalize a comprehensive suite of Loss and Damage (L&D) assessment tools, methodologies, and implementation guidelines to quantify and document disaster aftermath impacts as well as recurrent, climate-change-driven losses across landscape elements. The tools will be designed to assess losses and damages affecting more than 200 sectoral and cross-sectoral elements, including livelihoods and livelihood assets, food security systems, water security, and human security outcomes across climate frontlines. The assessment will explicitly account for protracted climate change processes, recurrent hazard events, and their spillover, multidimensional impacts over time.
MHEWC will apply an integrated ICT-enabled approach—combining GIS, remote sensing, mobile/data-collection applications, and UAV/drone-based imagery—to acquire and analyze climate risk, exposure, vulnerability, and impact attributes. Data will be generated through a combination of: (i) primary data collection from field surveys and participatory processes; and (ii) secondary data review from relevant institutions and sectoral sources. Secondary datasets and geospatial layers will be calibrated through systematic ground-truthing and spot verification to ensure accuracy and fitness for purpose, particularly for customized analysis, prioritization (“rationing”), and presentation of findings.
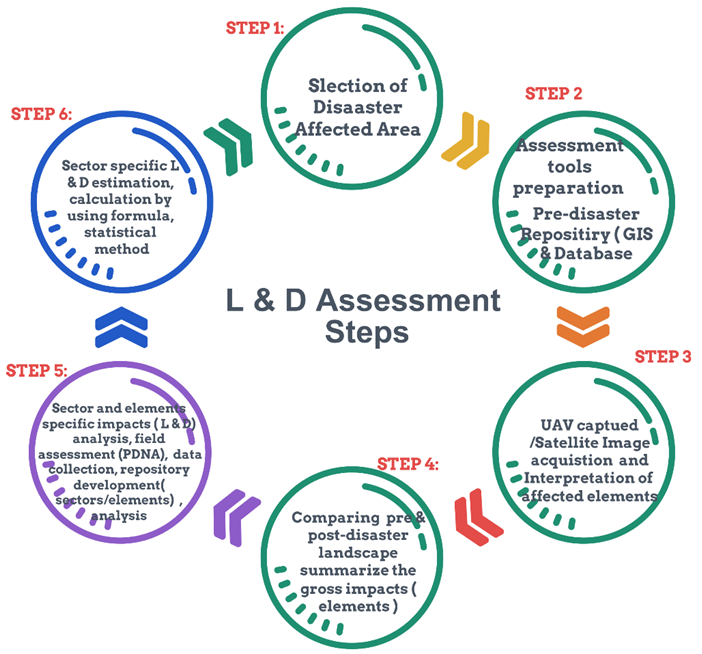
A robust scientific methodology (illustrated below) will guide tool development, data integration, validation, and analytical procedures to ensure methodological rigor, reproducibility, and decision-readiness. MHEWC intends to implement the proposed tools using open-source GIS and geospatial analytics platforms. :
- 1) Primary spatiotemporal data (georeferenced and time-stamped)
- Acquisition of high-resolution, georeferenced spatiotemporal datasets using:
- ICT-enabled GIS mapping tools
- Latest remote sensing imagery (satellite-derived products)
- GPS-enabled mobile applications for point/track capture
- UAV/Drone-based imagery and, where feasible, LiDAR (Light Detection and Ranging) for elevation/terrain and built-environment profiling
- 2) Primary impact-attribute and socioeconomic data (field-based)
- Collection of impact attributes through a strategic Community Risk and Vulnerability Assessment (CRVA), including:
- Household- and community-level climate/disaster risk and vulnerability data (CRA/CRVA)
- GPS-tagged capture of affected elements and service nodes using mobile GPS applications
- Socioeconomic and household survey data collected digitally using KoboToolbox (including standardized questionnaires and enumerator protocols)
- 3) Secondary datasets (official statistics and administrative records)
- Review and integration of secondary data sources, including:
- Bangladesh Bureau of Statistics (BBS) datasets, including HIES
- Age- and sex-disaggregated demographic and poverty datasets
- Census data from the national statistical system
- Local administrative and social protection datasets, such as:
- VGD/VGF beneficiary lists and related registers from Union Parishad
- Relevant assessment reports and studies undertaken by government, partners, and sector stakeholders (as available and applicable)
- 4) Geospatial and thematic data layers (multi-source)
- Compilation and harmonization of geospatial datasets from:
The Loss and Damage (L&D) assessment tools will be designed to facilitate systematic calculation and reporting of L&D across Local Government sectors aligned with Bangladesh’s National Adaptation Plan (NAP), including (but not limited to): water resources; disaster risk management; social protection, safety, and security; agriculture; fisheries, aquaculture, and livestock; ecosystems, wetlands, and biodiversity; urban areas; and Local Government Institutions (LGIs).
To enable high-resolution and decision-ready assessments, MHEWC will develop Local Government GIS basemaps and integrated geospatial tools that combine: (i) climate and multi-hazard exposure, risk, and vulnerability (CRVA) layers; (ii) impact-based forecasting and early warning information; and (iii) spatial analytics to support L&D estimation at the highest feasible grid resolution. These outputs will also be structured to inform Post-Disaster Needs Assessments (PDNA) and other risk-informed sector planning and investment processes.
A suite of ICT-enabled Community-Based tools will be developed and deployed, including GIS mapping products, GPS-app-based field surveys, remote sensing and image analysis workflows, and KoboToolbox-based digital data collection. These tools will support community-level climate exposure, risk, and vulnerability assessment (CVRA/CRVA), multi-hazard risk mapping, and development of a structured repository (geodatabase) containing verified baseline and impact attributes.
In addition, MHEWC will develop an ICT-enabled geospatial dashboard and tailored data repository that consolidates CRVA and L&D datasets to support post-disaster recovery design. The system will enable systematic estimation of loss and damage across different hazard onsets—before impact (impending hazards), during landfall and interaction with ground-level elements, and after an event—thereby strengthening preparedness, rapid assessment, and recovery programming across affected areas.
ii) Conduct climate and multi-hazard exposure, risk, and vulnerability (CRVA) survey:
An updated CRVA baseline repository and context-specific assessment tools are essential prerequisites for categorizing and calculating element-specific exposure, risk, and vulnerability arising from impending transboundary and residual hydrometeorological, climatic, and non-climatic hazards with the potential for high impacts. Accordingly, MHEWC will conduct a Union-level CRVA survey using a structured sampling approach (e.g., a cluster sample survey) that reflects local landscape vulnerability and homogeneous socioeconomic conditions, including livelihood asset profiles, prevalence of income poverty, and related vulnerability determinants.
The CRVA will generate element-wise primary datasets for the sectoral and cross-sectoral elements already plotted in the Local Government GIS basemap. These datasets will be used to quantify and cluster exposure and vulnerability, enabling estimation of anticipatory loss and damage associated with impending multi-hazards, as well as persistent and residual risks that remain and intensify over time.
In parallel, MHEWC Limited will conduct a KoboToolbox-based socioeconomic household sample survey to capture poverty, livelihoods, and vulnerability characteristics at household and community levels. The sampling framework will be designed to ensure coverage of communities with broadly homogeneous socioeconomic and livelihood conditions, thereby strengthening comparability, representativeness, and analytical rigor of the CRVA outputs.
b) Develop CRVA database:
The CRVA repository database is to be developed with hybrid sources of information, e.g., primary data from the CRVA survey, and cluster household survey. Secondary data from multiple sources e.g. Statistical (HIES) datasets, age-sex disaggregated data, Statistical Census data, Socio-economic (Poverty data, VGD/VGF datasets from Local Governments ( entities), and other relevant assessment studies being undertaken. Other relevant datasets from the local level livelihood interventions. Exclusive PRA process (FGD, KII, transact walk) to be conducted at the household level (sample survey of homogeneous socio-economic group, vulnerable community, sector-specific CRVA survey). CRVA is intended to capture climate and multi-hazard risks and vulnerabilities with summarized historical hazards and disaster repositories of the last 30 years from secondary sources.
i) Feeding local level Impending multi-hazard exposure, risk, and vulnerability by the Uapzila, Union & Ward Disaster Management Committee to geospatial platform :
Mobile phone ( android ) based WhatsApp group and GPS apps to be installed with oriented to the UDMC/WDMC members, local volunteers, vulnerable groups, NGO workforce, NGO running IGA groups etc. to provide the geocooMHEWCnates to project actual areas of the extent of flooding, flash flooding, storm surge, coastal flooding, salinity intrusion to livelihood assets, sudden onset tornadoes, heavy rainfall-induced loss and damages are likelihood and prevailing on the ground.
c) Develop GIS map-based online geospatial tools and evidence-based L&D calculations:
Since intended L & D assessment tools and dashboard would be deployable to calculate L & D on the fly at the event of multi-hazard early warnings are being issued. MHEWC Limited intended to develop a Geospatial online platform using Open layer and leaflet tools. The Local Government Disaster Management Committee, National Civil Protection Committees, Village/Community/Ward level Disaster Management Committee, extension officers, NGO servicemen, lead farmers, and social volunteer groups to provide inputs of geocooMHEWCnates on the area of extents of prevailing hazards on the grounds and L & D figures to delineated and distribute on the geospatial online platform. Develop a High-resolution lowest level local government grid map (5km×5km) and show multi-hazard conditions impacting the elements to easily calculate the L & D of physical, socioeconomic, and financial assets at the local level.
d) Develop geospatial platform :
To enable ICT-driven, evidence-based geospatial services, MHEWC will install and operationalize an open-source geospatial platform to host, manage, analyze, and disseminate CRVA and Loss & Damage (L&D) datasets. The platform will be built using a modular stack such as GeoNode, GeoServer, PostGIS/PostgreSQL, and web mapping libraries (Leaflet and/or OpenLayers) and will be configured to interface with desktop GIS environments (ArcGIS Pro and QGIS) for advanced editing and analysis workflows.
The system will support uploading and managing Union-level CRVA basemaps, including all mapped elements and their associated attribute information, and will enable layered visualization and spatial analytics at the highest feasible grid resolution. Key technical functions will include multi-layer overlay, querying, and grid-based aggregation of multi-hazard exposure, risk, vulnerability, and impact attributes, including (but not limited to):
- Coastal and hydro-climatic hazards: salinity intrusion zones, groundwater contamination/pollution areas, coastal inundation/water encroachment, river flooding, flash flooding, persistent waterlogging, and riverbank erosion
- Agriculture and land impacts: waterlogged agricultural land, char lands, standing crop loss, seeding and sapling loss, and other production-stage impacts
- Socioeconomic and infrastructure impacts: damage to socioeconomic infrastructure and service facilities
- Systemic and value-chain losses: disruption and systemic L&D across value-chain operating elements (inputs, production, storage, transport, processing, markets)
Overall, the geospatial platform will function as a repository and decision-support system for CRVA, impact-based analysis, and L&D calculation supporting rapid post-disaster assessment, PDNA inputs, and risk-informed sectoral planning.
i) Usability of evidence-based geospatial online/offline System for L & D assessment :
Facilitate dashboard-based government mechanism of climate/multi-hazards exposure, risk, and vulnerability by engaging Stakeholders :
The proposed geospatial, evidence-based platform will enable Local Government disaster management authorities to strengthen risk governance by operationalizing GIS-driven Standing Orders on Disaster (SOD) in response to locally issued early warnings for impending multi-hazards. The system will be designed as a robust, integrated “one-stop” solution architecture that supports coordinated decision-making, preparedness actions, and response planning across the local disaster management ecosystem.
A core function of the dashboard will be to digitize and operationalize the SOD by translating early warning triggers and risk layers into actionable coordination guidance based on the “5W” modality—who will do what, when, where, and how. This will facilitate real-time tasking, role clarity, geographic targeting, and monitoring of preparedness and response actions at Union and community levels.
To ensure inclusivity and practical utility, the platform will be designed for multi-stakeholder access and engagement, including (as applicable):
- Local Disaster Management Committees and relevant government line departments
- NGOs and community-based livelihood/IGA groups
- Women’s groups and vulnerable population networks
- Civil Society Organizations (CSOs) and Community-Based Organizations (CBOs)
- Community volunteers, student brigades, local clubs, charities, and other social groups
Through controlled access, role-based views, and shared geospatial information, the platform will enable stakeholders to align preparedness and response actions with dynamic risk information—thereby improving anticipatory decision-making, reducing coordination delays, and strengthening local-level disaster readiness.
e) Calculating anticipatory of L & D onset of impending multi-hazards early warning being issued :
This component will establish an ICT- and geospatially enabled process to generate anticipatory (pre-impact) Loss & Damage (L&D) estimates when multi-hazard early warnings are issued. The approach integrates impact-based forecasting, high-resolution spatial analytics, and the CRVA baseline repository to produce decision-ready L&D summaries for preparedness, humanitarian action planning, PDNA inputs, and recovery design.
e.1 Data inputs and integration
Impact-based forecasts will be developed at 5 km × 5 km grid resolution (or finer where feasible) using the following inputs:
- Bangladesh Meteorological Department (BMD) forecast datasets (CSV and other machine-readable formats) and observation parameters
- BMD observation datasets of key weather variables (e.g., rainfall, wind speed/direction, temperature, pressure)
- Department of Agricultural Extension (DAE) agro-climatic and agriculture-relevant local datasets (Union/Upazila level, where available)
- Upazila and Union administrative basemaps for spatial overlay and reporting
- The CRVA baseline repository, linked to Union GIS maps and uploaded into the geospatial platform, including mapped elements and attributes (exposure, vulnerability, critical assets, livelihoods, value chain nodes, etc.)
All Union basemaps and CRVA element layers will be hosted in the geospatial platform to enable rapid overlay, querying, and automated analytics during warning activation.
e.2 Hazard footprint delineation during early warning activation
When a flood or cyclone early warning is issued, the system will delineate hazard footprints and intensity/severity zones by combining forecast data, historical parameters, and spatial models. This includes:
- Cyclone and storm impacts: analysis of cyclone track, intensity, probable landfall-adjacent impact zones, and storm surge influence areas
- Flood impacts: delineation of probable inundation extent and depth using forecast rainfall/river conditions and reference thresholds (e.g., HFL—Highest Flood Level, where applicable)
- Riverbank erosion: identification of riverbank stretches likely to erode or be washed out under projected flows and flood intensity
- Persistent/slow-onset impacts: mapping and classification of areas prone to prolonged waterlogging, salinity intrusion, and groundwater quality degradation where these are relevant to the event context
Hazards will be classified and mapped by type and intensity, including (as applicable to the locality and season): salinity intrusion, groundwater pollution/contamination, coastal/riverine inundation, flash floods, river floods, riverbank erosion, persistent waterlogging in agricultural land, char land exposure, standing crop loss, seeding/sapling loss, damage to socioeconomic infrastructure, and systemic value-chain L&D due to disruption of operating elements..
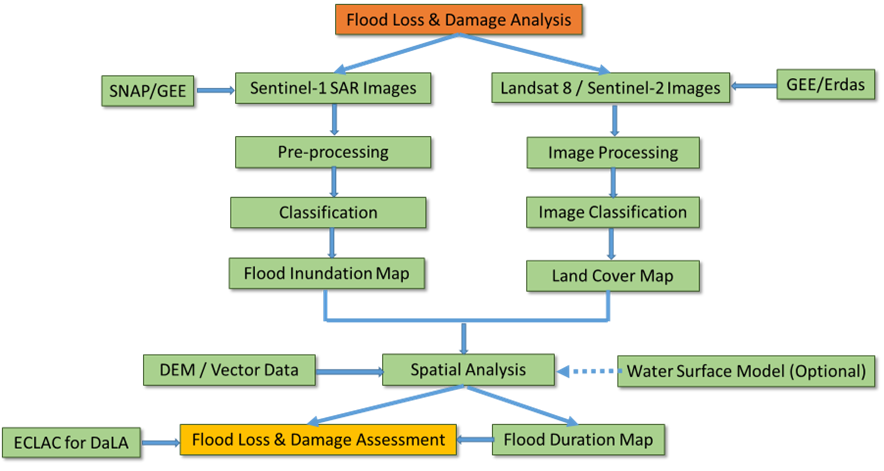
The above methodology will be applied to calculate Loss and Damage (L&D) for flood events in the Kurigram study area using satellite-based remote sensing and GIS analytics. The process will generate flood extent, land cover, and inundation duration outputs and integrate these with mapped “elements at risk” to estimate sector-wise damage and loss.
To extract flood extent, Sentinel-1 SAR imagery will be used to overcome cloud-cover constraints during the monsoon season. Flood-water classification will be performed using SNAP (Sentinel Application Platform) following standard preprocessing steps (e.g., radiometric calibration, speckle filtering, terrain correction, and geocoding). In parallel, Google Earth Engine (GEE) may be used to automate and validate flood extent mapping and to support rapid multi-date flood delineation.
To generate land cover/land use baselines, Landsat 8 or Sentinel-2 imagery from the pre-monsoon period will be used. Prior to classification (supervised and/or unsupervised), required corrections will be applied, including atmospheric, geometric, and radiometric corrections. These steps can be conducted in Google Earth Engine or desktop environments such as ERDAS IMAGINE, depending on data availability and processing requirements.
Once flood extent and land cover maps are produced, they will be integrated with vector datasets representing elements at risk (sectoral assets, infrastructure, livelihoods, and services). Using ArcGIS Spatial Analyst and relevant geoprocessing functions (e.g., overlay, intersect, zonal statistics, raster-to-vector conversion), inundated and damaged elements will be identified and quantified. Where multi-date imagery is available, a flood duration (inundation persistence) map will be developed from time-series flood extents to estimate inundation duration—particularly relevant for crop-specific impact assessment (e.g., paddy).
Following identification of inundated/damaged features, elements will be categorized sector-wise and L&D will be calculated using the ECLAC damage and loss methodology (developed by the UN Economic Commission for Latin America and the Caribbean). Sector-specific calculation procedures and assumptions are detailed in the relevant section of this inception report.
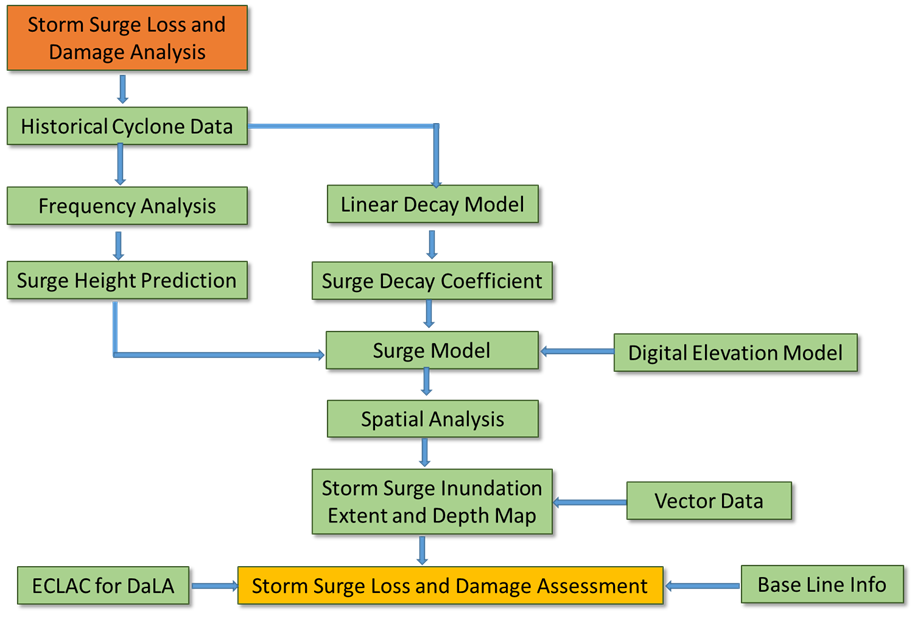
f) Loss and Damage Estimation for Storm Surge
The storm surge L&D estimation will follow the surge modeling workflow described in the methodology section, integrating return-period–based surge height estimation, inland surge decay modeling, and DEM-driven inundation depth/extent mapping. The resulting storm surge depth and extent layers will be overlaid with the Union-level CRVA element inventory to identify exposed and damaged elements and to generate sector-wise L&D summaries using the ECLAC damage and loss methodology.
Loss and Damage Estimation for Salinity Intrusion (Satkhira)
The above methodology will also be applied to estimate Loss and Damage (L&D) associated with salinity intrusion in the Satkhira study area. To identify salt-affected areas, Landsat 8 OLI (Operational Land Imager) satellite imagery will be used. Following required image corrections (e.g., radiometric and atmospheric corrections, and geometric alignment where applicable), relevant spectral indices will be computed using image processing software such as ERDAS IMAGINE or ArcGIS Pro, including:
- NDSI (Normalized Difference Salinity Index) to characterize salinity-related surface conditions
- NDVI (Normalized Difference Vegetation Index) to capture vegetation stress and productivity changes associated with salinity impacts
Salinity intensity classes will be derived from index values and spatial patterns. In general, higher NDSI values indicate higher salinity, while NDVI typically exhibits an inverse relationship (i.e., lower NDVI may indicate vegetation stress consistent with increased salinity), subject to local calibration and validation.
After generating salinity intensity and extent layers, these outputs will be integrated with vector datasets representing elements at risk (with a primary focus on crops and agriculture-related livelihood elements). Using ArcGIS spatial analysis tools (e.g., overlay/intersect, zonal statistics, raster reclassification), affected elements will be identified and quantified.
Finally, exposed/damaged elements will be categorized sector-wise and ECLAC’s damage and loss methodology will be applied to calculate sector-specific and aggregate L&D for salinity intrusion. Detailed sectoral calculation steps and assumptions will be provided in the corresponding section of the inception report.
Loss and Damage Estimation for Salinity
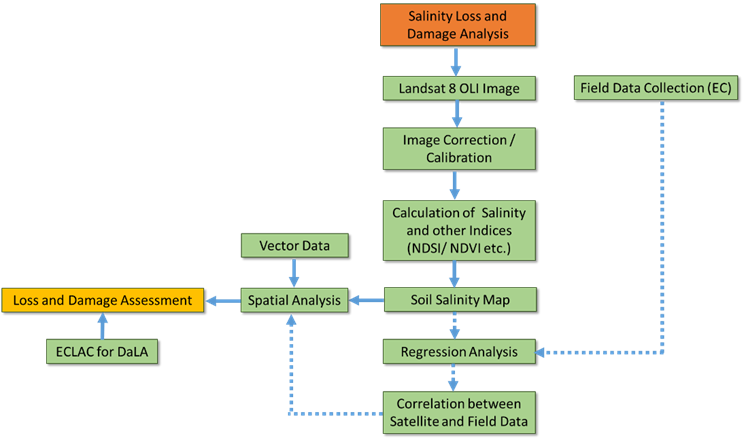
The above methodology will be used to calculate loss and damage (L&D) for Salinity Intrusion in Satkhira area. In this methodology, to identify salt affected area, Landsat 8 OLI (Operational Land Imager) satellite data will be used. After performing necessary correction in the image, different indices like NDSI (Normalized Difference Salinity Index), NDVI (Normalized Difference Vegetation Index) are calculated using Image processing software like Erdas Imagine or ArcGIS Pro. From indices values, intensity of Salinity can be assumed. If NDSI value is high, Salinity will be high. But for NDVI, this relationship will be reverse.
After getting the indices and soil salinity extent together with vector data (elements at risk), damaged elements (mainly crops) will be identified using ArcGIS platform. As elements at risk are identified, categorize the elements sector wise and apply ECLAC to calculate the loss and damage for salinity intrusion.
4.2 L&D Repository development
A professional-grade Loss & Damage (L&D) repository will be developed to enable high-quality visualization and evidence generation through GIS maps, infographics, dashboards, and structured databases, presenting L&D in both spatial and temporal dimensions. The repository will function as the authoritative baseline and event-based record for diagnosing impacts, validating results, and supporting decision-making across preparedness, response, PDNA, and recovery planning.
4.2.1 Specific objectives
The L&D repository will be designed to:
- Generate defensible evidence to identify, quantify, and support formal declaration of L&D within the defined geographic scale.
- Enable spatio-temporal comparison and trend analysis of L&D indicators across events, seasons, and years.
- Produce decision-ready L&D maps, dashboards, and infographics as core evidence products.
- Assess deterioration, accumulation, and transformation of key geographic and environmental properties (e.g., salinity expansion, land degradation, persistent waterlogging, erosion hotspots, changes in land use/land cover).
- Provide reference evidence to inform policy recommendations, advocacy and communication products, and support climate mitigation/adaptation programming and L&D negotiation narratives.
4.2.2 Data sources to populate the repository
The repository will integrate primary, secondary, and geospatial datasets, calibrated through ground-truthing and spot verification to ensure fitness-for-purpose.
1) Primary data
- Strategic Community Risk and Vulnerability Assessment (CRVA/CRA) reports
- Household and community-level survey datasets
- GPS-app-based capture of element locations and impact attributes
- KoboToolbox-based socioeconomic datasets (poverty, livelihoods, vulnerability profiles)
2) Secondary data
- BBS HIES datasets
- Age- and sex-disaggregated demographic data
- BBS Census datasets
- Local administrative records: poverty lists, VGD/VGF datasets from Union Parishad
- Relevant assessment reports and sector studies (as available)
3) Geospatial and Earth observation data
- Administrative GIS layers and sector GIS datasets
- Remote sensing products (Sentinel/Landsat, and derived thematic layers)
- GPS tracks/points and field-verified observations
- Drone imagery (and LiDAR where available/feasible)
- Google Earth Engine workflows and Google Earth visual verification layers
4.2.3 Repository structure and analytics design
The repository will be established as a structured geodatabase linked to Union/Upazila base maps and configured for:
- Element inventory management: standardized cataloguing of sectoral and cross-sectoral elements (exposed assets, services, livelihoods, natural resources, value chain nodes) with unique IDs and consistent attributes.
- Event-based layers: hazard footprints (e.g., flood extent, storm surge extent/depth, salinity classes) and intensity/severity surfaces.
- Grid-based analytics: L&D estimation and aggregation at 5 km × 5 km (or finer) grid resolution where feasible, with roll-up summaries by Union/Upazila and sector.
- Temporal versioning: pre-event baseline, event impact snapshots, and post-event updates to enable time-series comparisons.
- Quality assurance: systematic validation through ground-truthing and spot checks, including metadata documentation (source, date, resolution, processing steps, confidence level).
4.2.4 Coverage and field survey approach
The repository will be designed to support Union-level analysis for Kurigram and Satkhira, including climate/multi-hazard exposure, risk, and vulnerability (CRVA) layers, and impact-based forecasting overlays. Given the assessment time limitations, the primary field survey will focus on approximately 25% of the most vulnerable Unions, using a transparent selection method (e.g., risk-ranked vulnerability scoring and feasibility screening).
4.2.5 L&D calculation approaches
The repository will support sector-specific and cross-sector L&D computation, including:
- ECLAC damage and loss methodology for multi-sector L&D estimation and standardized reporting across sectors and assets.
- FAO Damage & Loss (D&L) methodology for agriculture-related sectors, providing procedural and computational steps applicable across event scales and contexts. The FAO framework covers direct damage and losses across:
- Crops
- Livestock
- Forestry
- Aquaculture
- Fisheries
Together, these methods capture the total effect of disasters on agriculture and enable consistent integration into overall L&D results.
4.3 Agriculture Damage Computation Procedures
| Type of informed tools required | Data sources | Usability for identifying the gross damage /loss | Calculation of economic loss |
| Prepare standing crop distribution map of the affected Union | Typically required FGD/KII with DAE, Lead farmer, vulnerable small holder farmer, group of individual farmers (for time limitation conducts desk-based assessment | Overlaying disaster impact layer over Union, identify the gross impacted area (severe flooding, moderate flooding, normal flooding) and estimate gross damage from GIS spatial analytical tools | The gross estimation/calculation of economic loss by analyzing following variables factored by prevailing disaster and multi-hazard conditions over the ground No of days disaster impacts persistsType of crop damaged/impacted Duration of crop sensitivity & standing capacity( flood tolerant/ salinity tolerant variety ) against prevailing hazards. |
| Prepare crop calendar | As above | Identify aftershocks/consecutive impacts days of sensitivity over the elements of agroecology, Based on magnitude of prevailing disaster/hazards are spanning over the agroecologist/crops system and identify upcoming residual impacts over cops are likely to be planed for season ahead.Identify the impact factors over the crop suitability for next cropping season and anticipatory yield loss factors | Estimate loss factor of disaster aftermath residual impacts form magnitude of prevailing disaster conditions over the days/weeks/months |
| Livelihood calendar for occupational of group | Prepare livelihood calendar of occupational of group ( day laborers, farmers, small business, shopkeeper, traders, fishermen, livestock farmers etc.) ( for time limitation conducts desk based assessment ) | Identify the number of functional/earning and non-functional/non-earning days | Estimation of both economic and non-economic loss |
| Prepare calendrer of elements/component of functional economic activity/business traction (retail/wholesale) of market, growth center, small hat/bazar being impacted by prevailing disaster/multi-hazards | Conduct FGD/KII with stakeholders ( for time limitation conducts desk based assessment ) | Identify the number of functional/earning and non-functional/non-earning business days | Estimation of both economic and non-economic loss by alazying the following variables; No of business unit damaged by disaster (type) with calculated economic value.No of business unit & transactional liquidity per business day/hat-bazar dayUnit/components wise income per day during normal situation No of nun-functional daysGross estimation of loss per day |
Crop-Agricultural Damage and Loss estimation/calculation
| Growing Season | Type of standing crops | Disaster type | No of Impact days | Crop area impacted | Yield value per Bigha/Acres | Damaged area | Economic loss amount |
| Kharip-1 (March-July) | Traditional variety Paddy and other standing crops Hazard tolerant variety of Paddy and other standing crops | FloodStorm SurgeOthers | |||||
| Kharip-2 (July-October) | |||||||
| Robi (October-March) |
Analysis impacts over standing crops :
| Type of informed tools required | Data sources | Usability for identifying the gross damage /loss | Calculation of economic loss |
| Prepare standing crop distribution map of the affected Union | Typically required FGD/KII with DAE, Lead farmer, vulnerable small holder farmer, group of individual farmer ( for time limitation conducts desk based assessment | Overlaying disaster impact layer over Union, identify the gross impacted area ( severe flooding , moderate flooding, normal flooding ) and estimate gross damage from GIS spatial analytical tools | The gross estimation/calculation of economic loss by analyzing following variables factored by prevailing disaster and multi-hazard conditions over the ground No of days disaster impacts persistsType of crop damaged/impacted Duration of crop sensitivity & standing capacity( flood tolerant/ salinity tolerant variety ) against prevailing hazards. |
| Prepare crop calendar | As above | Identify aftershocks/consecutive impacts days of sensitivity over the elements of agroecology, Based on magnitude of prevailing disaster/hazards are spanning over the agroecologist/crops system and identify upcoming residual impacts over cops are likely to be planed for season ahead.Identify the impact factors over the crop suitability for next cropping season and anticipatory yield loss factors | Estimate loss factor of disaster aftermath residual impacts form magnitude of prevailing disaster conditions over the days/weeks/months |
| Livelihood calendar for occupational of group | Prepare livelihood calendar of occupational of group ( day laborers, farmers, small business, shopkeeper, traders, fishermen, livestock farmers etc.) ( for time limitation conducts desk based assessment ) | Identify the number of functional/earning and non-functional/non-earning days | Estimation of both economic and non-economic loss |
| Prepare calendrer of elements/component of functional economic activity/business traction (retail/wholesale) of market, growth center, small hat/bazar being impacted by prevailing disaster/multi-hazards | Conduct FGD/KII with stakeholders ( for time limitation conducts desk based assessment ) | Identify the number of functional/earning and non-functional/non-earning business days | Estimation of both economic and non-economic loss by alazying the following variables; No of business unit damaged by disaster (type) with calculated economic value.No of business unit & transactional liquidity per business day/hat-bazar dayUnit/components wise income per day during normal situation No of nun-functional daysGross estimation of loss per day |
Technical Approach of Methodology :
Consultation :
Data Collection :
a) Geospatial Datasets:
- LANDSAT-1f SAR
- image,
- Sentinel-1
- Google earth, Google Earth Engine
- GIS base Map (Secondary Sources)
b) Statistical datasets:
- Conducted CRA reports from UP/ NGOs
- Crop extent area and cropping data from DAE
- Statistical data on the fisheries pond from the Fisheries department
- Other features are data from Upazila Government Departments
- HIES data from BBS
- Other relevant datasets ( e.g. Oxfam etc.)
Calculation of L & D
1) Defining baseline risk and vulnerability conditions:
- Baseline Scenario – Detailed spatial distribution of multi-hazards over the GIS Base maps (Most vulnerable, Moderate Vulnerable, Vulnerable ) based on frequency and impact intensity .
- Delineated impact areas from historical multi-hazards with impact categories(Most vulnerable, Moderate Vulnerable, Vulnerable )
2) Estimation/Statistics of elements (food sector/livelihood) are likely to be damaged( forecasted) :
- Anticipatory loss and damage calculations based on Impending Hazards (forecasted Flood, water logging, flash floods, tidal surge, storm surge, high winds, hailstorm, nor ’wester, tornadoes etc.) = Extent of areas of hazards are likely to be impacting the number/volume of elements (food/livelihood sector) to be impacted
- Statistics of elements (farmland, standing crops, Seedling/Sapling, homestead gardens, fish ponds) likely to be damaged.
- Calculation of economic loss of damaged farmlands, standing crops, seedlings/saplings, homestead gardens, and fish ponds ( Current market price)
3) Calculation/Estimation/Statistics of elements( food sector/livelihood) are being damaged by the hazards/disaster occurred:
- Statistics of elements (farmland, standing crops, Seedling/Sapling, homestead gardens, fish ponds ) being impacted by disaster ( Flood, storm surge )
- Calculation of element-specific economic loss of damaged farmlands, standing crops, seedlings/saplings, homestead gardens,and fishing ponds ( Current market price)
[1]&2 Due to time-limit the process may not be followed